
Transcranial colour-coded duplex (TCCD) ultrasound has recently become more widely adopted in critical care. The European Society of Intensive Care Medicine (ESICM) highlights B-mode TCCD insonation of the middle cerebral artery as a fundamental ultrasound skill for an intensive care specialist. Specifically, ESICM recommends TCCD for triaging and assessing patients with suspected intracranial hypertension, emphasising its role in early detection and management of critical neurological conditions. This recommendation includes qualitative waveform analysis and pulsatility index (PI) measurement. Although TCCD can be used for assessment of suspected cerebral circulatory arrest, detection of cerebral vasospasm following subarachnoid haemorrhage, evaluation of ischaemic stroke, and assessment of intracerebral pathology, the ESICM does not identify these as essential skills for intensivists. Due to the complexity of the procedure, TCCD in such cases should be performed by specialised clinicians only. Specifically, the ESICM does not consider detecting cerebral vasospasm after subarachnoid haemorrhage as a basic skill, as part of the panel regarded this examination, due to being too complex for routine intensive care unit (ICU) training. Similarly,the evaluation of ischaemic stroke and intracerebral pathology, and assessment of autoregulation were deemed beyond the basic skillset required for ICU assessments. TCCD can be valuable in various clinical scenarios, including midline shift, cerebral circulation status assessment, and left-to-right shunts, such as those seen in patients with patent foramen ovale. Furthermore, ultrasono-graphy can measure the optic nerve sheath diameter, providing additional diagnostic information [1–10].
TECHNIQUES
TCCD, as a combination of two-dimensional imaging of parenchyma colour Doppler and Doppler pulse wave technology, is an advanced method used for high-precision real-time scanning. TCCD allows visualisation of flow inside arteries in relation to pivotal anatomic landmarks. The assessment of the flow direction facilitates the correct identification of cerebral arteries. The precise placement of the Doppler gate under visual control ensures accuracy of this technique. TCCD is performed using a low-frequency phased array probe (2–2.5 MHz), preferably with a transcranial Doppler (TCD) preset. Low frequencies reduce attenuation caused by the bone. TCCD uses relatively thin bone windows, corresponding to four main acoustic windows: transtemporal, transorbital, suboccipital, and, less commonly used, submandi-bular [1, 7, 11–14].
ACOUSTIC WINDOWS AND PERFORMANCE
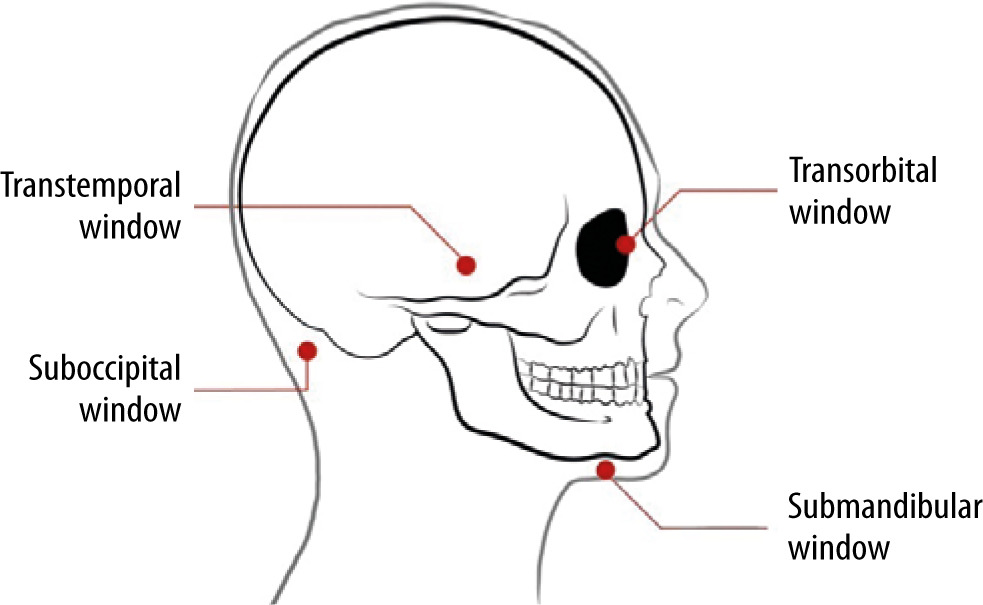
There are four specific windows that allow insonation of the brain and its vessels. The location of the transtemporal one corresponds to the area of low skull bone thickness, allowing for ultrasound waves to penetrate (Figure 1). The suboccipital window uses the natural foramen in the skull, namely the foramen magnum. The transorbital window allows for assessment of structures within the orbit, without penetrating the bone [2, 6, 11, 14].
FIGURE 1
Acoustic windows used in transcranial colour-coded duplex (adapted with permission from intensywna.pl)
The transtemporal window is most commonly used for transcranial ultrasound examination, due to favourable temporal bone thickness [2]. The phased array probe is positioned on the temple, just above the zygomatic arch, between the orbit and the ear. The probe marker should be pointed towards the patient’s eye. The patient’s head should be elevated above 30°. Insonation through this window allows for visualisation of the midbrain and, when angled 10° upwards, the diencephalic plane with the third ventricle and circle of Willis [2, 6, 11, 15]. When using the TCD preset, the probe marker will be visible on the left side of the screen. One should be able to recognise the contralateral skull and bilate-ral thalami. First, after placing the probe at a right angle (mesencephalic plane), the midbrain is visible (Figure 2). If the sphenoid bone is visible, the probe should be angled up [2–9, 11]. According to the lite-rature, 5 to 20% of patients have insufficient transcranial acoustic access via the transtemporal windows due to higher bone thickness. In such patients, assessment of abovementioned elements will be unfeasible [3, 11].
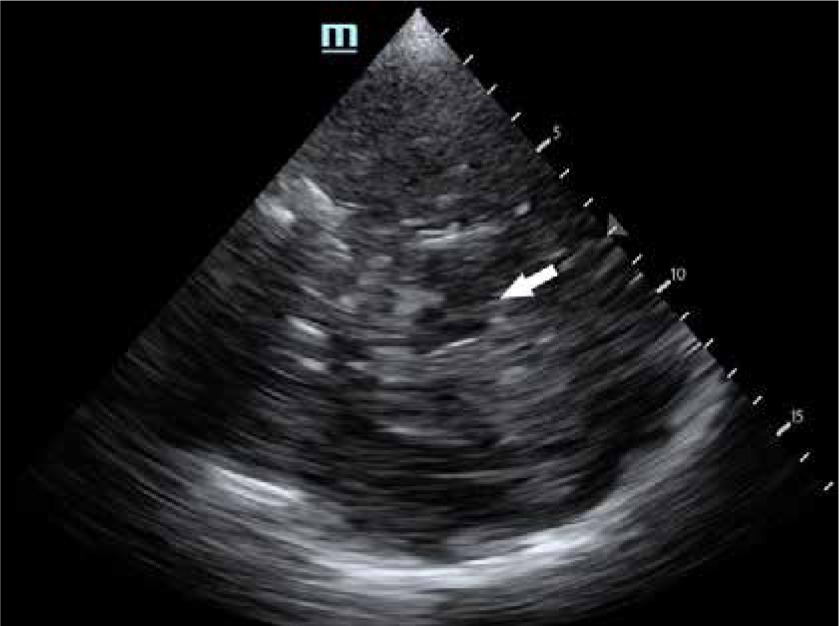
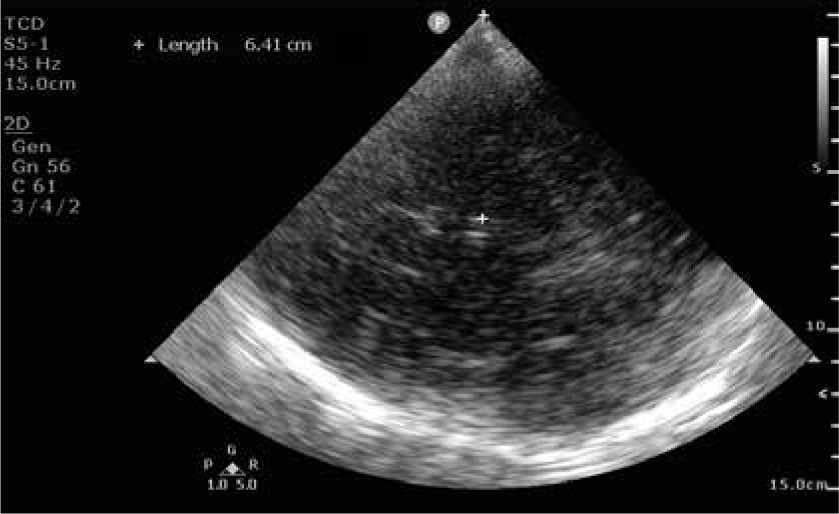
FIGURE 2
Mesencephalic plane visible after placing the probe in the temporal area. The landmark is the midbrain marked with a white arrow. It resembles a butterfly with its wings pointed anteriorly
After visualisation of the mesencephalic plane, the probe should be tilted up 10°. In this plane, called the diencephalic plane, the third ventricle is seen as two pulsating parallel lines, usually less than 10 mm apart from one another (Figure 3). After localising the plane, colour Doppler should be engaged. Using a standard setting of Doppler, the middle cerebral artery (MCA) is visible as a red stripe, indicating blood flow heading towards the probe. The anterior cerebral artery (ACA) appears as a blue stripe, as the blood flows away from the probe in the setting. The proximal segment (P1) of the posterior cerebral artery (PCA) is seen as a red stripe, while the distal part (P2) is seen as a blue stripe. Once the MCA is located, the pulse wave Doppler function should be selected, and the cursor adjusted so the gate is directly in the middle of the MCA. After the engagement of the pulse wave Doppler, the spectral waveform can be observed. Most devices offer automatic measurements [2–9, 11].
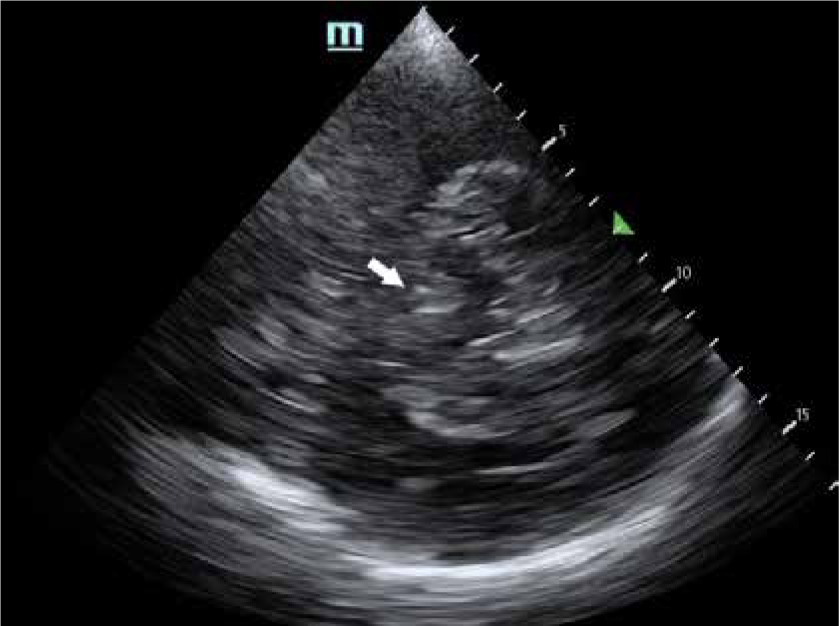
FIGURE 3
Diencephalic (or third ventricle) plane. The third ventricle is marked with a white arrow. The two parallel white lines are located anterior to the midbrain
The transorbital window is approached through a closed eyelid using the linear or phased array transducer. The transducer should be placed over an eyelid. This window allows visualisation of the ophthalmic artery, the carotid siphon, and the optic nerve sheath. It should not be used in patients after lens replacement surgery, as there may be side effects of insonation [2, 6, 11]. To protect the lens and retina, the examination should be performed according to the ALARA (as low as reasonably achievable) principle. The acoustic output of the ultrasonic instrumentation must be adjusted to the requirements of orbital sonography [16, 17].
The suboccipital window is localised between the posterior margin of the foramen magnum and the spinous process of the atlas (C1). The phased array transducer should be placed midline or on each side of the spinal column, 2.5 cm below the edge of the skull, with an ultrasound beam aiming at the bridge of the nose. The index marker should point towards the eyeball. This window enables the examiner to visualise the foramen magnum and the intracranial portion of vertebral arteries and the basilar artery (BA) [2, 6, 11].
The submandibular window is located at the angle of the mandible. The linear probe should be placed laterally under the jaw anterior and me-dial-ly to the sternocleidomastoid muscle. It is not an acoustic window per se but allows an extracranial approach to the distal segment of the extracranial internal carotid artery (ICA). This enables one to calculate the mean flow velocity (MFV) ratio between the MCA and the ICA, which is called the Lindegaard index (LI) (discussed in more detail in the “Vasospasm” section) [2, 6, 11, 18, 19] (Table 1).
Table 1
Insonation windows with their vasculature
[i] The spectral measurement technique above was evaluated for blind transcranial Doppler by Aaslid. For transcranial colour-coded duplex it facilitates proper differentiation between vessels. 1Flow direction is described as toward or away from the transducer (below or above baseline of the spectral waveform). 2Mean flow velocity (MFV) stands for MFV in given arteries; it helps to set a proper pulse repetition frequency/scale to visualize the vessels.
PHYSICS OF SPECTRAL DOPPLER IMAGING
Echoes received by a probe are processed into a spectral waveform [7]. The spectral waveform in TCCD consists of three relevant components: (1) peak systolic velocity (PSV), which depends on the cardiac output and depicts systemic rather than cerebral haemodynamics; (2) end diastolic velocity (EDV); (3) and MFV. These values are measured in cm s–1.
These basic values are used to calculate the resistance index (RI). RI describes resistance to the flow of blood into organs. When the resistance increases, the blood flow during diastole (EDV) decreases. When EDV is zero, the RI equals one [2, 13].
Gosling’s PI describes quantitative changes in the morphology of the TCCD waveform. It is one of the most relevant parameters.
PI is proportional to the compliance of the arterial wall, heart rate, and peripheral cerebrovascular resistance. PI estimates non-invasively intracranial pressure (ICP) [2, 4, 11, 16, 19]. A result below 0.5 may be suggestive of a proximal narrowing or occlusion. PI between 0.5 and 1.2 is considered normal. PIs higher than 1.2 suggest a distal occlusion. When the blood flow hits the occlusion, the flow stops abruptly, resulting in a decrease in diastolic flow, reversed flow, or absent flow [3, 19].
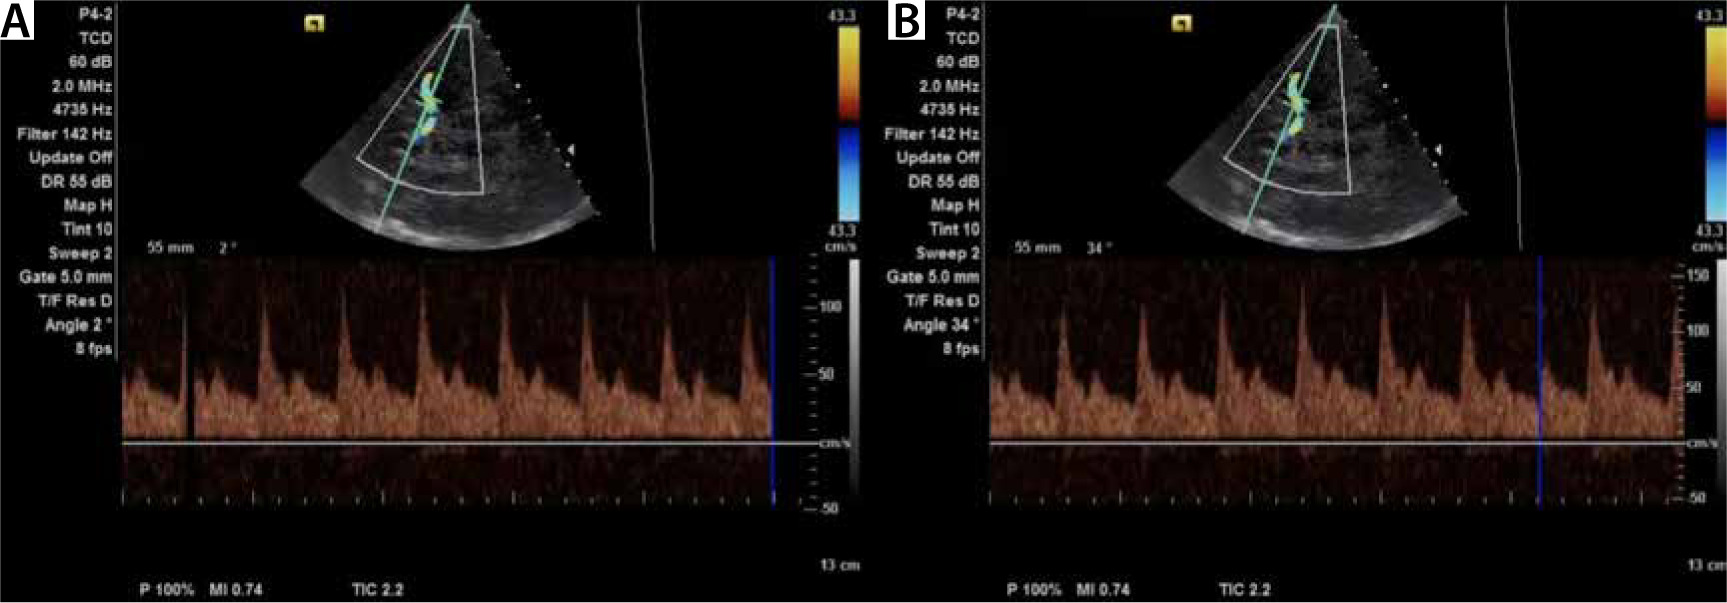
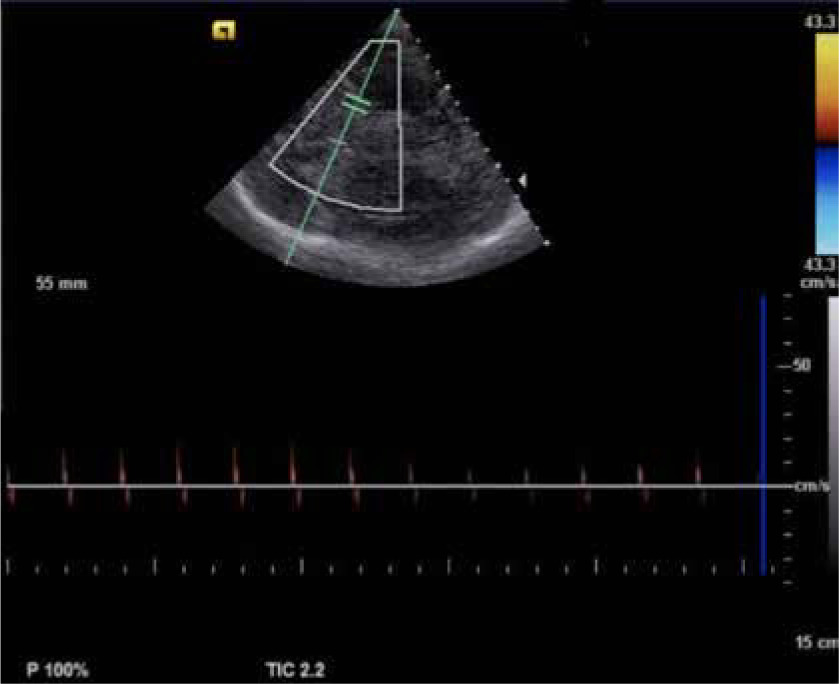
Using TCCD, angle correction can be performed to avoid a potential source of error. Angle correction improves the accuracy of TCCD for the detection of elevated ICP (Figure 4) [20].
APPLICATIONS IN ICU
Vasospasm
TCCD demonstrates sensitivity of 90% and specificity of 71% for the detection of severe vasospasm [4]. Vasospasm following subarachnoid haemorrhage contributes to a 15–20% risk of stroke or death [3]. It is estimated that vasospasm occurs in 30–70% of patients after aneurysm rupture. Typically, vasospasm does not occur until day 3. Its frequency peaks between days 6 and 12 and falls 15–20 days after the haemorrhage [2]. Flow velocity (FV) is inversely proportional to the diameter of a vessel. Therefore, the greater the severity of vasospasm, the higher the blood FV. This can be observed until the critical stenosis is reached and FV decreases. The parameters needed to identify vasospasm are PSV, EDV, MFV, and RI. The normal Doppler waveform pattern of the MCA has a sharp systolic upstroke with a stepwise diastolic deceleration (Figure 5). A normal MFV for the MCA is usually 80 cm s–1 or lower. The MFV cut-off value for the absence of vasospasm in the MCA is below 120 cm s–1. Values between 120 and 200 cm s–1 indicate mild to moderate vasospasm. MFV higher than 200 cm s–1 is indicative of severe vasospasm. Increased values of MFV are insufficient to diagnose vasospasm. The diagnosis should include clinical assessment, as hyperaemia, hypertension, or hypervolemia may be responsible for vasospasm [2–5, 7, 13, 15, 19, 21–23, 25–31].
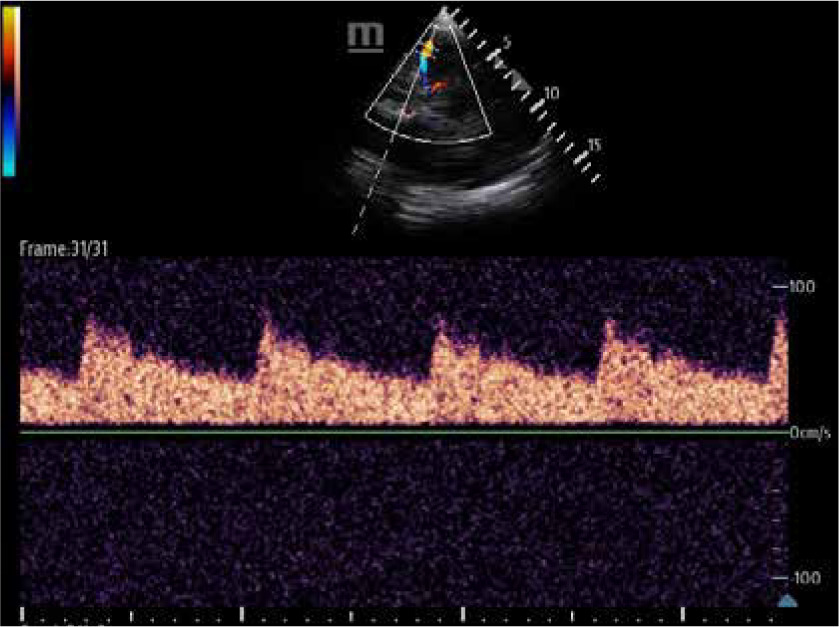
FIGURE 5
Normal Doppler waveform pattern of the middle cerebral artery with a sharp systolic upstroke followed by a stepwise diastolic deceleration
To distinguish between these states, Lindegaard et al. [32] created a ratio that compared MFV in both MCA and ipsilateral extracranial ICA (eICA). The LI grades the severity of vasospasm but used alone does not differentiate vasospasm from other causes of increased MFV.
Lindegaard index = MFVMCA/MFVeICA
MFV for MCA can be measured via a transtemporal window, while MFV for eICA can be measured via the cervical access using a linear probe. Pathologies of carotid arteries, such as atherosclerotic plaques, may affect blood FV and therefore alter LI [2–4, 6, 7, 9, 11, 13, 23, 32–34] (Table 2).
Table 2
Severity of vasospasm in relation to mean flow velocity (MFV) and Lindegaard index
| Severity of vasospasm | MFV [cm s–1] | Lindegaard index |
|---|---|---|
| Mild | < 120 | < 3 |
| Moderate | 120–150 | 3–6 |
| Severe | > 150 | > 6 |
Soustiel et al. [35] proposed a BA/extra-cranial vertebral artery (BA/EVA) flow velocity ratio for assessment of posterior circulation vessels. Flow velocity in BA of 80 cm s–1 is a threshold indicative of vasospasm. The BA/EVA ratio > 2 indicates vasospasm (100% sensitivity, 95% specificity).
There are no clear criteria of vasospasm for ACAs and PCAs other than comparisons of daily increases of velocities [36].
To distinguish the two causes of increased blood FV, one may also evaluate a waveform during diastole. Subsequent bedside examinations may be necessary to detect vasospasm after a subarachnoid haemorrhage, as it can occur within the first two weeks. Monitoring trends in cerebral blood flow velocities and comparing these values daily is essential, with a rapid rise of ≥ 50 cm s–1 over 24 hours signalling a high risk for delayed cerebral ischaemia. Clinical symptoms typically manifest at MFV around 160 cm s–1 [2, 3, 7, 13].
Intracranial pressure assessment
Elevated ICP causes a secondary brain injury and contributes to worse patient outcomes [4]. TCCD is a tool that allows assessment of ICP and cerebral perfusion pressure (CPP) via different ultrasound-based methods. These techniques include the analysis of blood FV and the optic nerve sheath diameter (ONSD). In some cases, the measurement of midline shift (MLS) may also be of use [4, 11, 19].
Analysis of flow velocity
The MCA is the most representative artery to evaluate blood FV waveform. As cerebral arteries are surrounded by parenchyma, the rising ICP results in increased resistance to flow and, therefore, in a decrease in diastolic CBF velocities. Initially, velocity in MCA increases during systole and decreases in diastole. With further rise of ICP, the diastolic flow diminishes until it is absent or reversed. Waveforms become peaked and consequently PI increases. The end-stage intracranial hypertension results in cerebral circulatory arrest and brain death (Figure 6) [3, 11, 23].
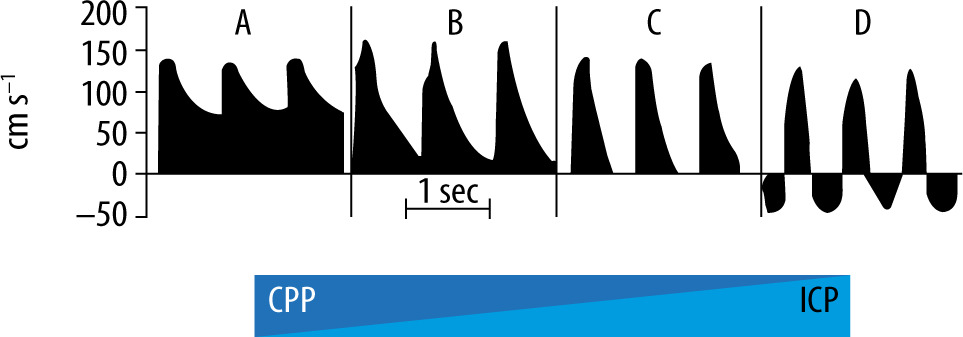
FIGURE 6
Progressive waveform changes because of the increase in intracranial pressure leading to cerebral circulatory arrest (adapted with permission from intensywna. pl)
CPP – cerebral perfusion pressure, ICP – intracranial pressure
While Gosling’s PI reflects changes in TCCD waveforms associated with ICP, it lacks precision for exact ICP quantification. Various methods for ICP and CPP estimation have been proposed, yet none have achieved the accuracy required for absolute ICP measurement [4, 5]. Czosnyka et al. [37] presented a non-PI formula with improved accuracy for non-invasive CPP (nCPP) estimation.
The quantitative method of the Czosnyka equation allows one to assess non-invasive ICP (nICP):
nCPP = invMAP × (EDV/MFV) + 14
nICP = invMAP – nCPP,
where invMAP stands for invasive mean arterial pressure [37].
Other documented techniques are too complex for routine clinical application. Consequently, PI-based ICP evaluations are more appropriate for monitoring trends rather than determining precise ICP levels. Compared to alternative approaches, TCCD waveform analysis serves as a useful preliminary tool for ICP evaluation, facilitating the early detection of elevated ICP and the potential need for invasive monitoring [11, 23, 38, 39].
Optic nerve sheath diameter
The sheath around the optic nerve consists of dura, arachnoid and pia mater, which contains a small amount of cerebrospinal fluid (CSF). Increase of CSF pressure causes transmission of force through the spaces and may be visualised as a distension of the ONSD. The distension of the ONSD is seen especially in the anterior retro-bulbar compartment. There is a linear relationship between peri- optic CSF pressure and ICP. According to the litera-ture, ONSD increases in direct proportion to ICP, also reflecting changes during osmotic therapy or carbon dioxide variations [7, 11, 40–42]. Similarly, ONSD has a small value in the case of decreased ICP [40].
Sonography of the ONSD is performed using a high-frequency linear probe (7.5 MHz or more). The probe is placed carefully on the temporal part of the closed upper eyelid using a thick layer of ultra-sound gel. The patient is in a supine position with his head and upper body elevated 20–30o. One should not exert pressure on the eyeball, to avoid damaging it. The examination is performed in B-mode in both transversal and sagittal planes. If possible, the globe should be kept in the centre of the imaging frame and the imaging axis should be in line with the optic nerve where the optic nerve is perpendicular to the globe and demonstrates its maximum length along the image frame. The depth should be set to visualise the space around 1.5 cm behind the eyeball. The ONSD is measured 3 mm posterior to the retina. The optic nerve is a hypo-echogenic tortuous structure that extends posterior to the retina. The hyperechogenic structure that surrounds the nerve is the three-layer nerve sheath (Figure 7) [7, 11, 40, 43–45]. To protect the lens and retina, the examination should be performed according to the ALARA (as low as reasonably achievable) principle [16]. If available, the ocular preset should be used. If this preset is unavailable, one should manually adjust the thermal index (TI) and mechanical index (MI). The ONSD POCUS Quality Criteria Checklist from 2024 recommends reducing scan times and acoustic powers, as well as using MI ≤ 0.23 and TI ≤ 1. ONSD should be measured independently from both sides [45].
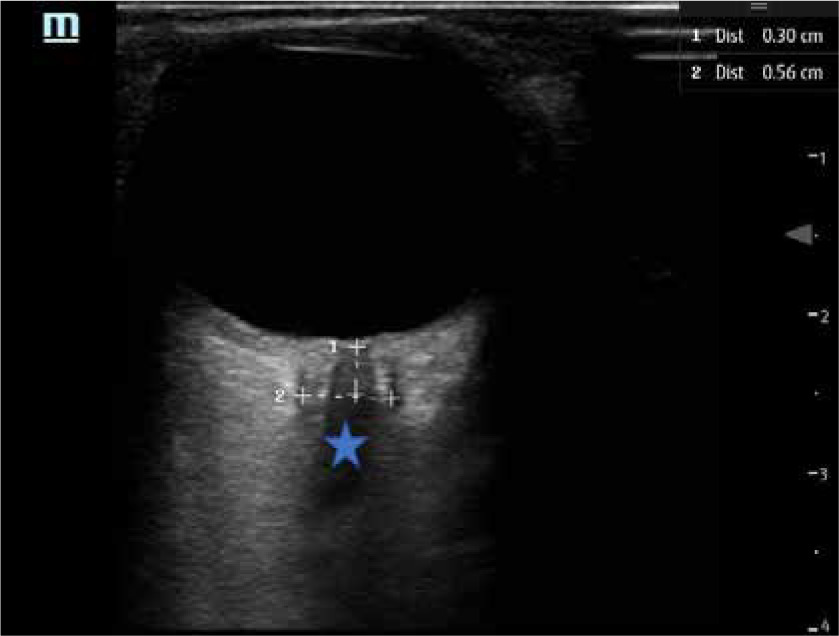
FIGURE 7
Example of optic nerve sheath diameter (ONSD) measurement. The ONSD is measured 3 mm behind the retina along the optic nerve (*) in a plane perpendicular to the optic nerve axis. In this example, the ONSD value is 5.6 mm
Physiology revision
Cerebral blood flow (CBF) is constant with a value of about 50 mL/100 g min-1 in a wide range of pressure from 50 to 150 mmHg. This feature is called cerebral autoregulation. Due to myogenic response, the contraction of the cerebral artery occurs when the intravascular pressure is elevated and, conversely, the vasodilation follows a decrease in pressure.
When the CBF falls below 50 mL/100 g min-1, cerebral ischaemia occurs.
Potential artefacts should be taken into conside-ration. The retina may cast a hypoechogenic conic-like shadow behind the ocular globe that mimics an enlarged optic nerve sheath. In this case, colour Doppler helps to distinguish these structures, since the retinal artery and vein pass through the middle of the optic nerve [7, 11, 46].
ONSD values between 4.8 and 6 mm reflect the normal ICP that is ≤ 15 mmHg. The meta-analysis by Robba et al. [7] showed that sonography of the ONSD has good diagnostic accuracy for the evaluation of a binary model (present/absent), especially when invasive ICP measurement methods are unavailable or unwanted [11, 47–50].
The learning curve to perform ONSD measurements includes as few as 10 scans for an expe-rienced sonographer, whereas a novice sonographer should perform about 25 examinations to gain performance competence [11, 40, 44].
Cerebral circulatory arrest
Brain death is defined as the irreversible loss of all functions of the brain, including the brain- stem [2]. TCCD has high accuracy in confirmation of cerebral circulatory arrest (CCA). In many countries, it is used as a supplementary test to confirm brain death [7, 49].
There are predictable, stepwise patterns of cerebral blood flow changes corresponding to the increase of ICP, decreased blood flow and herniation. Increasing ICP leads to the arrest of the cerebral arterial circle. The FV and waveforms are evaluated in the middle cerebral, vertebral, and basilar arteries. Initially, diastolic FV diminishes until ICP equals diastolic arterial pressure and the velocity approaches zero. With a further increase in ICP, diastolic flow reappears in the opposite direction (oscillating or reverberating flow). When ICP is high enough to cause arrest of cerebral blood flow, brief systolic spikes with < 50 cm s–1 peak systolic FV and < 200 m s–1 duration appear. They are followed by the total disappearance of the Doppler waves (Figure 6) [2, 3, 11, 13, 23, 51, 52].
Both oscillating flow and systolic spikes are conclusive of cerebral circulatory arrest since they indicate that anterior, posterior, and lateral arteries are affected (Figure 8). To avoid errors, the patient should be in normothermia (> 35.1oC). Systolic arterial pressure during tests must be maintained over 80 mmHg and heart rate below 120 min-1. The criteria must be met in bilateral middle cerebral, vertebral and basilar arteries. It should also be highlighted that drugs depressing the central nervous system do not interfere with the TCCD measurements in this protocol. The criteria may vary among countries, depending on legislation at the national level [2, 3, 52–55].
The sensitivity of TCCD-based brain death diagnosis is 89% and its specificity is 98% [40, 47, 56]. Although TCCD is a reliable method, it requires further confirmation and should not be used as the only confirming technique [57]. As an operator-dependent, experience-requiring technique, it has a false-negative rate as high as 10–20%. Moreover, residual blood flow may occur even after cerebral arteriography, in ventricular shunt, or in anoxic encephalography after cardiac arrest [53]. TCCD may be an ancillary test before performing brain CT perfusion or angiography. Analysis of characteristic waveforms in all the vessels of the circle of Willis through the transtemporal and occipital windows is consistent for CCA [5, 58, 59]. Two examinations should be performed to confirm brain death. The second trial should take place after 30 minutes [51]. According to Poltransplant (the Polish Centre for the Transplantation of Cells, Tissues and Organs) guidelines, TCD, not TCCD, is one of the mandatory ancillary tests to diagnose brain death. It may be performed by a physician certified by the Neurosonology Section of the Polish Neurological Society or after specialised training in TCD for confirmation of brain death. Cerebral circulatory arrest confirmed with TCD is not exempt from clinical examinations to diagnose brain death [60]. TCD is more feasible than other techniques (e.g. angiography) without requiring patient transport outside the ICU and is non- invasive [6]. Although it is not common, the use of ultrasound contrast agents could increase the rate of any conclusive cerebrovascular TCCD studies.
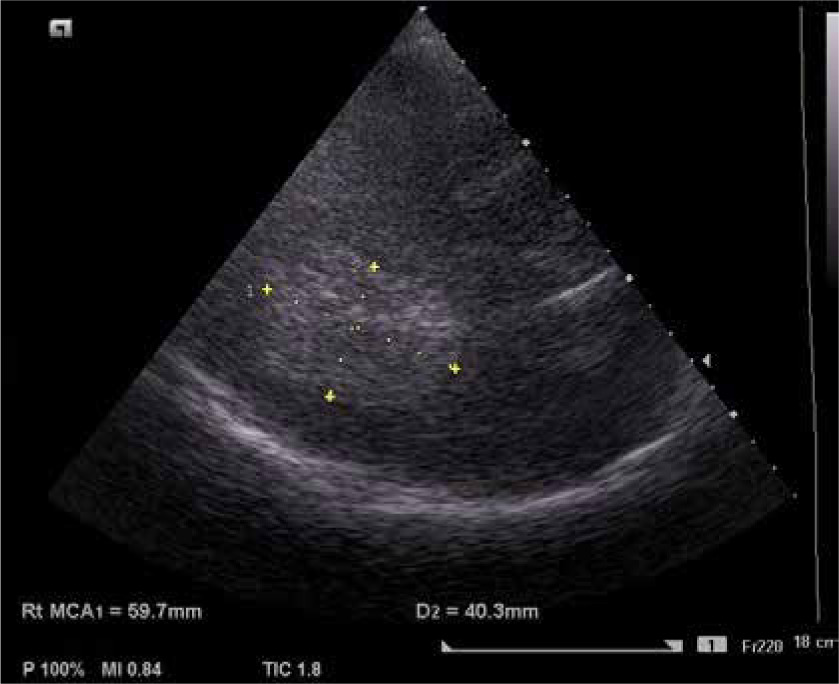
Midline shift
Ultrasound detection of midline shift correlates well with CT findings, which was confirmed in a study by Bertuetti et al. [11] on neurocritically ill patients. For midline shift above 0.25 cm in acute severe MCA territory stroke, sensitivity is 83% and specificity 100% [2, 53, 61]. Although CT remains the gold standard for midline shift measurement, ultrasound measurement could be considered for trend assessment [2, 7]. It is also a good early predictor in acute stroke patients [2, 11]. Clinically, midline shift should be evaluated together with cerebral blood flow measurements and right/left PIs comparison. In midline shift a discrepancy between CBF and PI is observed [3].
Midline shift = (distance A – distance B)/2,
where distance A is the distance between the ipsi-lateral temporal bone and the third ventricle on one side, and distance B is the same distance measured via the other transtemporal window. The proper midline shift value is zero. Midline shift higher than 0.5 cm is considered significant on head CT and correlates with poor neurological outcome (Figure 9) [15, 23, 62, 63].
In 2012 Caricato et al. [64] compared TCCD results with CT scans in patients with decompressive craniectomy. He assessed the midline in an axial plane as the line between two lateral ventricles. In this study, the falx cerebri both on frontal and occipital sides was localised and the distance between its extension and the interventricular line was measured as MLS shift. This method was compared with CT results and showed an excellent correlation between these two techniques.
Intracranial haematomas
Acute haematomas are hyperechogenic in ultrasound imaging, which corresponds histologically to tightly packed intact erythrocytes [64]. This stage lasts 1–5 days from the bleeding, and during this time it is possible to visualise haematomas (Figure 10) [62]. Haematomas’ echogenicity changes over time due to clot lysis. At this stage haematomas become hypoechogenic in the centre and are surrounded by a hyperechogenic halo [7, 64]. Brain ultrasono-graphy allows insonation of both supratentorial and infratentorial haematomas [7, 60]. Haematoma volume may be evaluated using the same equation as CT: (A × B × C)/2, where A, B and C stand for dimensions of the haematoma [7]. Some authors report that hyperacute or acute haematomas visualised in TCCD correspond well to CT findings [64, 65]. Nevertheless, while haematoma assessment may be possible, it is not a reliable method for their detection, and it is not applicable to the general population [62, 64]. Non-contrast head CT remains the method of choice for diagnosis and monitoring of intracranial bleeding. TCCD may be considered helpful for rapid bedside evaluation [61].
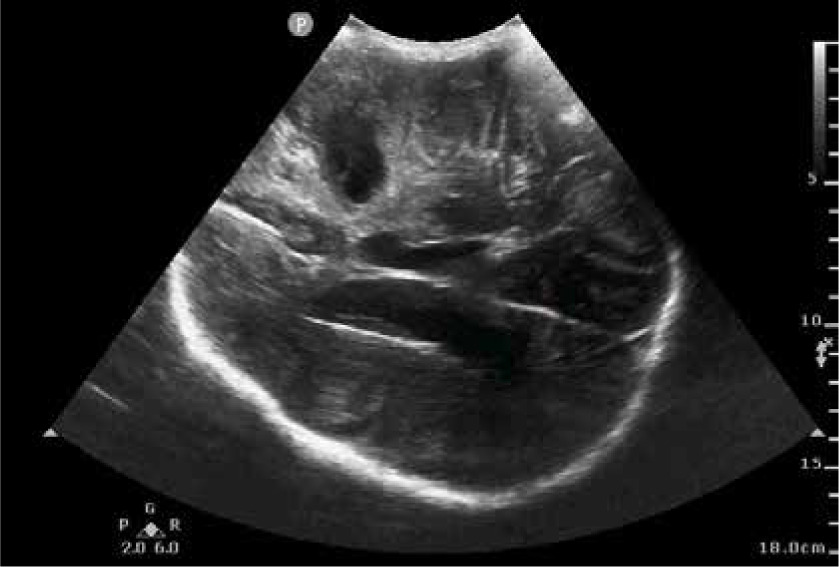
Hydrocephalus
CSF appears anechoic, whereas the ependymal cells that line the cerebral ventricles are hyperechogenic (Figure 11). The third and lateral ventricles are seen as double hyperechogenic lines, which allows measurement of their parameters [6, 40, 66]. There is an excellent correlation between TCCD and CT evaluation. TCCD can assess the need of external ventricular drainage (EVD) and its safe removal. The cut-off value for insertion of external drainage is 5.5 mm in the lateral ventricles’ width [3, 67, 68]. Moreover, TCCD can visualise the external ventricular drain tip [6]. A ventricular width lower than 5.5 mm is an indication for safe removal of EVD. Importantly, the decisions on surgical management of hydrocephalus should be based on CT imaging. What is more, the presence of hydrocephalus does not affect midline shift evaluation, since it is measured from the ipsilateral temporal bone to the middle of the third ventricle [3].
CONCLUSIONS
TCCD ultrasound has become an essential tool in intensive care medicine, particularly in the mana-gement of patients with traumatic brain injuries. It assists clinicians in both diagnosis and treatment monitoring by enabling the identification of vasospasm following subarachnoid haemorrhage and the detection of elevated intracranial pressure in patients with both traumatic and non-traumatic conditions. Although TCCD’s use in diagnosing intracranial haematomas and hydrocephalus is somewhat limited, it may still provide valuable diagnostic clues. Additionally, TCCD serves as an ancillary tool in the evaluation of cerebral circulatory arrest.
ESICM recommends TCCD insonation of the MCA as a core skill for intensivists, particularly for qualitative waveform analysis and PI measurement to assess cerebral perfusion status. Despite certain limitations, TCCD is an evolving field with significant potential to enhance the clinical management of critically ill patients [69].
Take-home messages
Vasospasm is a severe consequence of aSAH: TCCD of the cerebral arteries allows its timely detection.
There are three basic ultrasound methods to assess ICP: (1) analysis of flow velocity, (2) measurement of the ONSD, and (3) evaluation of brain midline shift.
Brain ultrasonography may allow the visualisation of hydrocephalus, cerebral emboli, occluded arteries, and, in some cases, haematomas.
The characteristic spectral waveform indicates cerebral circulatory arrest and may be an ancillary test before the confirmation of the diagnosis in an angio-CT scan.