
Aortic regurgitation (AR) is caused by incomplete diastolic closure of the aortic valve (AV). Diastolic regurgitation towards the left ventricle (LV) causes LV volume overload, resulting in eccentric LV remodelling.
The Framingham Study has reported a prevalence of traceable AR by echocardiography of 13.0% in men and 8.5% in women in the study population [1], with moderate and severe AR occurring in 0.5% of the total study population [2].
This review intends to give a comprehensive overview of the assessment of AR for clinicians working in fields other than cardiology. Echocardiography is the first line technical examination in assessment of AR, allowing a bedside approach to ICU patients. We focus on the underlying concepts and assumptions of calculating regurgitant volumes, regurgitant fraction (RF), and effective regurgitant orifice area (EROA). Qualitative and semiquantitative AR severity grading systems, used in echocardiography, are discussed. In this overview, we highlight that the final AR severity grading does not rely on one single echo parameter, but requires integration of information, obtained from 2D, M-mode, and Doppler colour flow mapping (CFM). Consistency between the different pieces of information is warranted.
Echocardiography also provides the key information regarding timing of surgical treatment of AR. Besides the AR severity grading, LV diastolic and diastolic dimensions, LV ejection fraction (LVEF), and the dimensions of the aortic root and ascending aorta can be measured.
AR severity assessment may be challenging, requiring multimodality imaging. We overview the strengths and disadvantages of CMR, strain imaging and transoesophageal echocardiography.
AETIOLOGY OF AORTIC REGURGITATION
Most authors have classified the aetiology of AR into two main classes: AV leaflet abnormalities and aortic root abnormalities. This classification is sensible, as each entity requires a different treatment strategy. The most common aetiologies are listed below [3]:
Leaflet abnormalities:
congenital bicuspid AV,
rheumatic valve disease,
atherosclerotic valve disease,
myxomatous valve disease,
infective endocarditis.
Aortic root abnormalities:
Rheumatic, bicuspid, and atherosclerotic disease were discussed in part I [4]. Endocarditis may induce AR either by obstruction of the diastolic closure of the AV by the vegetation, or by perforation of the leaflet.
Even when the valve cusps are normal, dilatation of the aortic root may cause AR due to geometric alteration in the supporting structures of the leaflets [3]. Annular dilation – dilation at the base of the aortic root – results in AR due to reduced coaptation of the AV leaflets. Normally, there is an area of overlap between the leaflets, the so-called apposition zone. Therefore, mild dilatation of the aortic root may occur without or with only mild AR. Chronic hypertension, cystic medial necrosis, syphilis and Marfan’s disease may cause annular dilation.
Aneurysm of the membranous septum (AMS) with ventricular septal defect (VSD) is often associated with AV prolapse and AR [5]. In patients with AMS and VSD, surgical resection of AMS with closure of the VSD is indicated to prevent progression of the AR [5, 6].
PATHOPHYSIOLOGY AND SYMPTOMS
Mechanism
Chronic AR causes LV volume overload, resulting in eccentric remodelling with increasing LV mass. According to the law of Laplace, LV wall stress = (LV pressure × radius)/LV wall thickness. As a compensatory mechanism to reduce the wall stress caused by LV dilation in patients with severe AR, LV wall thickening may occur, with a further subsequent rise in LV mass (Figure 1).
FIGURE 1
Pathophysiology of aortic regurgitation (AR). Description of the pathophysiology of AR. Increased left ventricle (LV) volume, increased stroke volume and reduced diastolic aortic pressure are the main pathophysiological features of AR (green), resulting in LV adaption to AR (orange). As the LV adaption cannot balance the AR overload any more, symptoms occur (red). CPP – coronary perfusion pressure, DP – diastolic blood pressure, LVEDP – left ventricular end-diastolic pressure
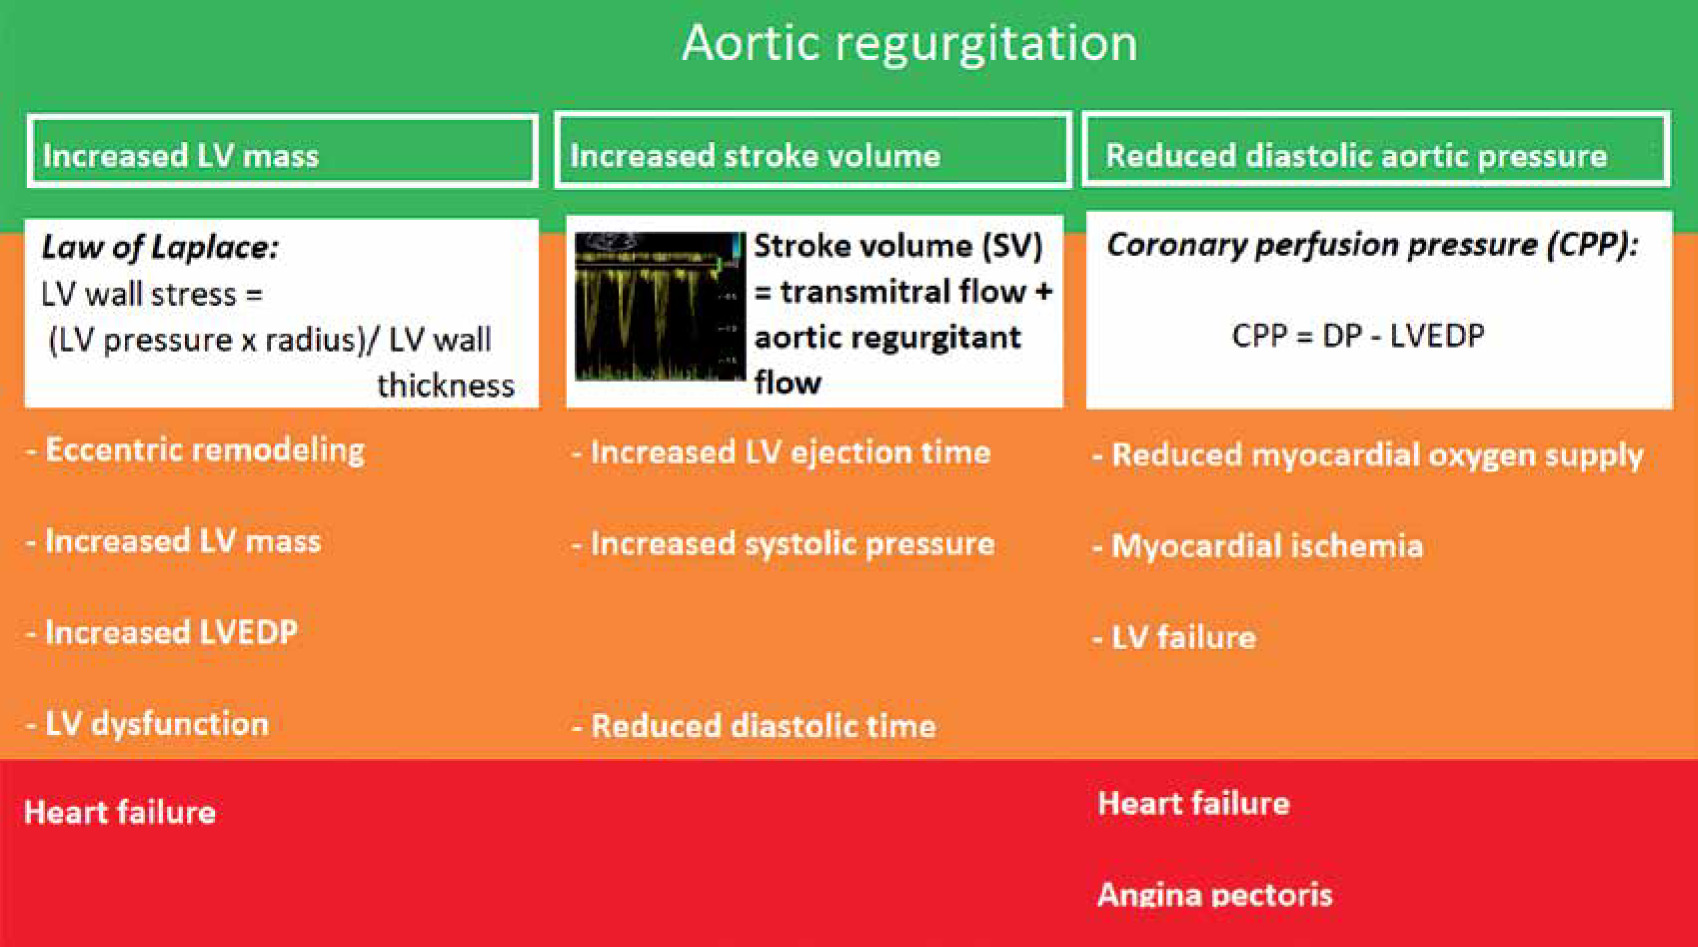
To maintain cardiac output, the stroke volume needs to increase to compensate for the aortic regurgitant flow. The left ventricular ejection time will increase with subsequent reduction of diastolic time. The increased systolic workload will result in higher myocardial oxygen consumption.
Another pathophysiological feature of severe AR is increased systolic blood pressure (due to the above-described increased stroke volume) and reduced diastolic blood pressure, due to the aortic regurgitant volume returning to the receiving dilated LV cavity. The coronary perfusion pressure (CPP), the driving force of myocardial perfusion, is the difference between diastolic pressure (DP) and LV end-diastolic pressure (LVEDP). Thus, the formula is:
CPP = DP – LVEDP
Due to the reduced DP, the CPP will decrease, resulting in reduced myocardial oxygen supply.
Initially these compensatory mechanisms will function well. Ultimately, LV dysfunction will occur and the disbalance between increased myocardial oxygen consumption and reduced myocardial oxygen supply will result in ischemia. Ischemia will induce further LV dysfunction. Finally, symptoms of congestive heart failure and/or angina pectoris will present.
Symptoms
Ultimately, most patients with severe AR will develop symptoms, with reported average rates of symptom onset of 5–6% per year in prospective studies [7, 8]. Usually, the initial symptoms are exertional dyspnoea and reduced exercise tolerance [9].
Severe AR is associated with a small risk of sudden death, occurring in 2–4% of patients over 7–8 years of follow up [9]. However, in the setting of ICU medicine, the diagnosis of severe AR is merely an occasional finding in the echocardiographic assessment of the LV function rather than a primary clinical consideration, except in the case of infective endocarditis.
ECHOCARDIOGRAPHIC ASSESSMENT OF AORTIC REGURGITATION
2D and M-mode echocardiography
2D and M-mode echocardiography contribute to the assessment of AR grading:
longstanding severe AR will result in LV dilatation (see pathophysiology section). The left ventricular end-diastolic diameter (LVEDd) is one of the criteria in the assessment of AR severity as well as the decision to refer the patient with AR for aortic valve replacement (AVR) [10] (Figure 2);
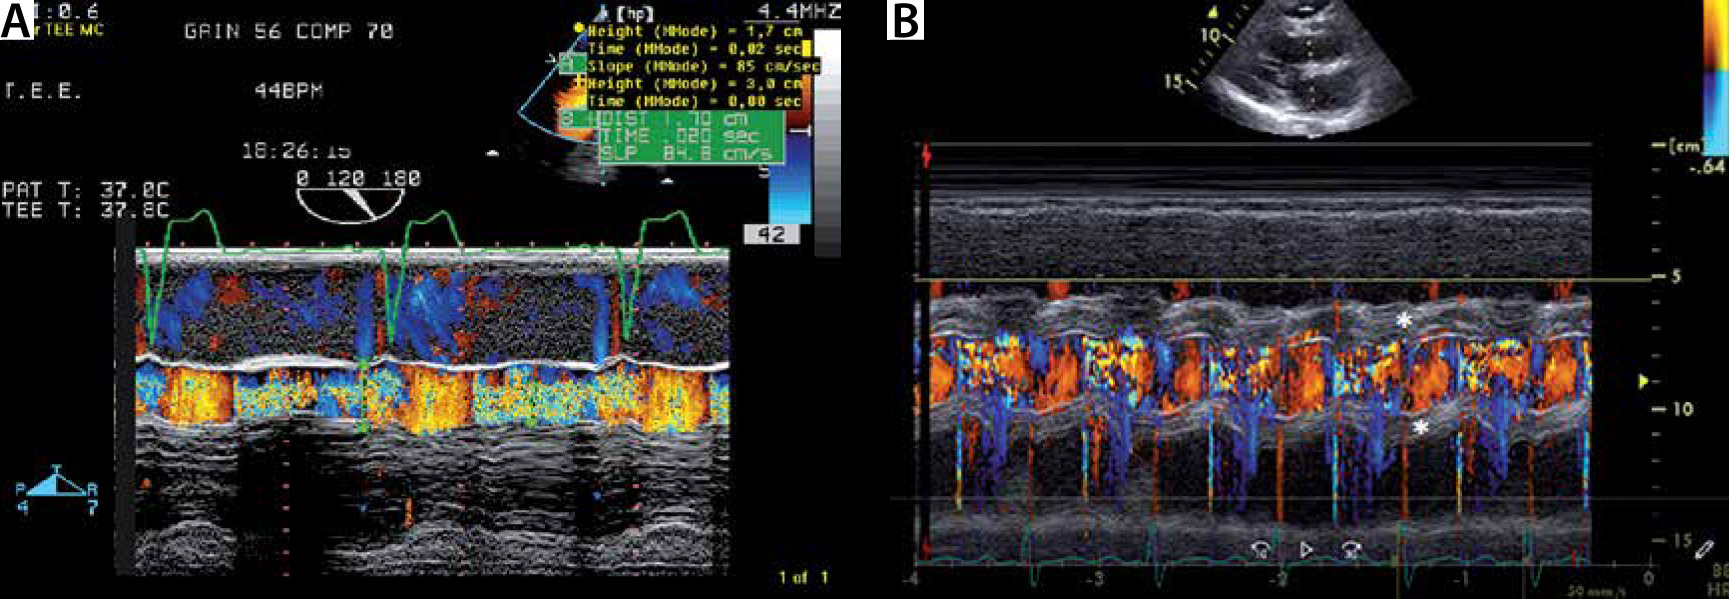
M-mode may show fluttering of the anterior mitral valve leaflet due to severe AR (Figure 3); a colour M-mode image through the LVOT may give an impression of AR jet width (Figure 4);
quantification of the LVEF is an essential part of the assessment of AR, as deterioration of LV systolic function is one of the key elements in clinical decision making, regarding timing of AVR.
FIGURE 2
M-mode imaging of the left ventricle (LV) from the parasternal long axis view. M-mode long axis view section of the LV in a patient with severe aortic regurgitation. Note the dilated LV with left ventricular end-diastolic diameter of 72 mm. Note the diastolic fluttering of the anterior mitral valve leaflet, due to impingement by the aortic regurgitant jet (white arrow)
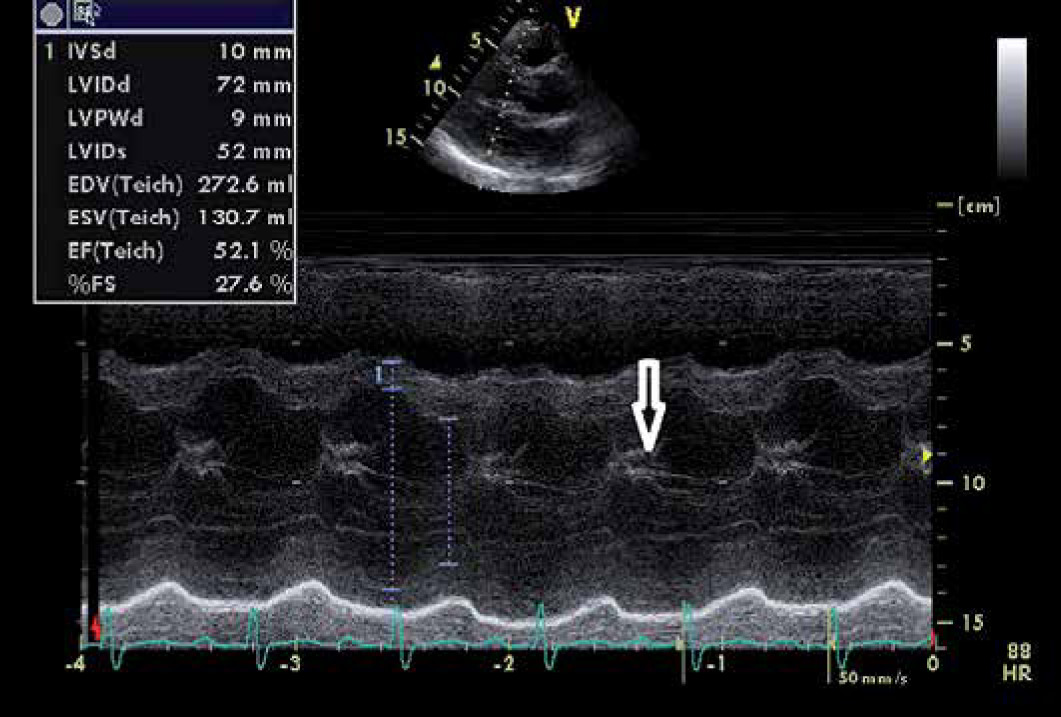
FIGURE 3
M-mode imaging of the aortic root. Measurement of the aortic root by M-mode Doppler in the parasternal long axis view. In this patient, the aortic root was dilated (4.5 cm)
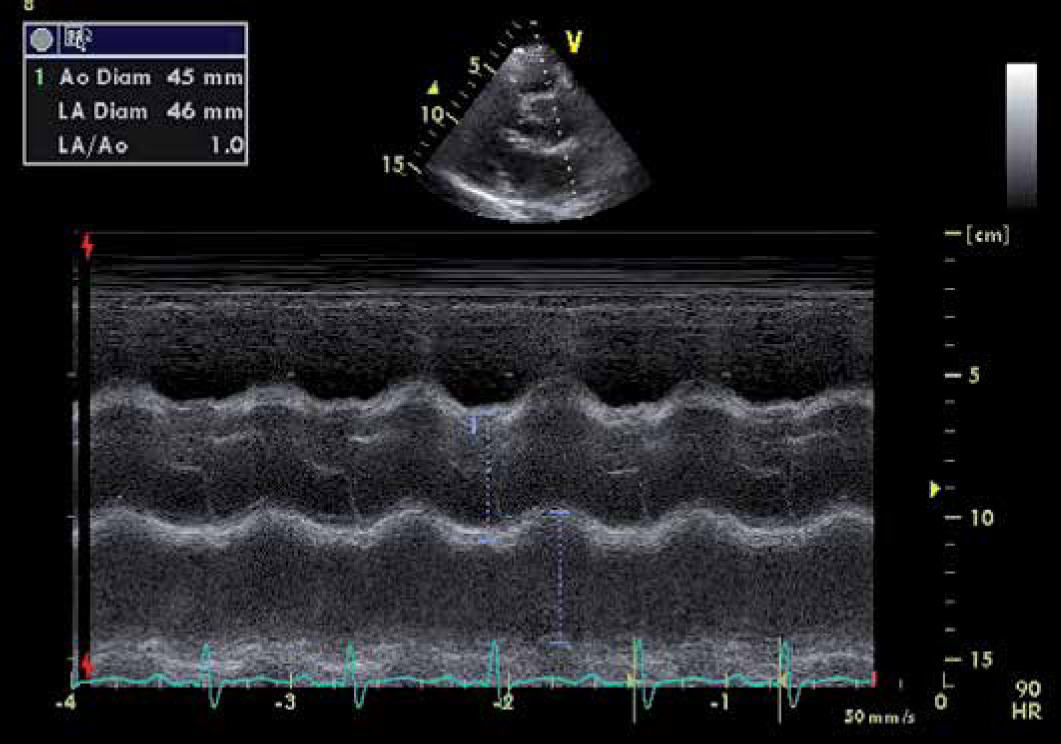
FIGURE 4
a) Colour M-mode through the left ventricular outflow tract (LVOT) in severe aortic regurgitation (AR). Colour M-mode of the LVOT. Note the diastolic regurgitation (mosaic colour due to turbulent flow). The AR jet width exceeds 50% of the LVOT diameter. B) Colour M-mode through the LVOT in a patient with severe AR due to infective endocarditis. Colour M-mode of the LVOT with the diastolic regurgitation (mosaic colour due to turbulent flow, like A. Note the thickening of the paravalvular area due to infestation of infection endocarditis (*)
Continuous wave (CW) regurgitation flow
Qualitative assessment of the CW regurgitant flow signal is useful to assess the severity of AR in 3 ways:
Density of the CW regurgitant flow: The Doppler signal intensity is proportional to the number of red blood cells contributing to the regurgitant signal. The ultrasound beam is relatively broad. Most of the regurgitant flow can be detected by adequate positioning of the ultrasound beam. The denser the regurgitant CW signal is, the greater is the AR volume. Comparison of the density of the CW signal between the antegrade and regurgitant flow is particularly useful. If the signal density of the regurgitant flow nearly equals the density of the antegrade flow, this implies severe AR. Conversely, a low density of the CW regurgitant flow reflects mild AR. A signal intensity between both former scenarios reflects moderate AS (Figure 5).
CW of the antegrade flow: In AR, the antegrade flow through the AV must increase, as the total flow through the AV is the sum of the net forward flow and AR flow. Thus, the antegrade flow and its peak CW velocity will increase when significant AR is present. Of course, the differentiation with concurrent AS should be made.
Shape of the CW regurgitant signal: The shape of the AR velocity curve depends on the time course of the diastolic pressure across the AV. When the LV diastolic pressure is low and aortic diastolic pressure is normal, the pressure gradient remains large throughout the diastole, with a slow decline of the transvalvular gradient. This principle is semi-quantified by measuring the pressure half time (see below: Pressure half time). In acute AR, there will be a rapid equalization of the pressure, with a more rapid decline in diastolic regurgitation (Figure 6).
FIGURE 5
Continuous wave (CW) signal of the aortic regurgitation. CW Doppler aortic regurgitant signal of a mild (a), moderate (B) and severe aortic regurgitation (AR) (C). a – Note the faint regurgitant signal in mild AR, due the lower flow of regurgitant red blood cells to be detected by the crystals in the echo probe. B – The density of the CW AR signal allows clear delineation of the entire regurgitant envelope. However, the forward flow has higher signal density. C – The CW AR signal has the same intensity as the forward blood flow. Also note the increasing deceleration shape of the CW AR jet, with increasing AR severity (see text, see also Figure 6)
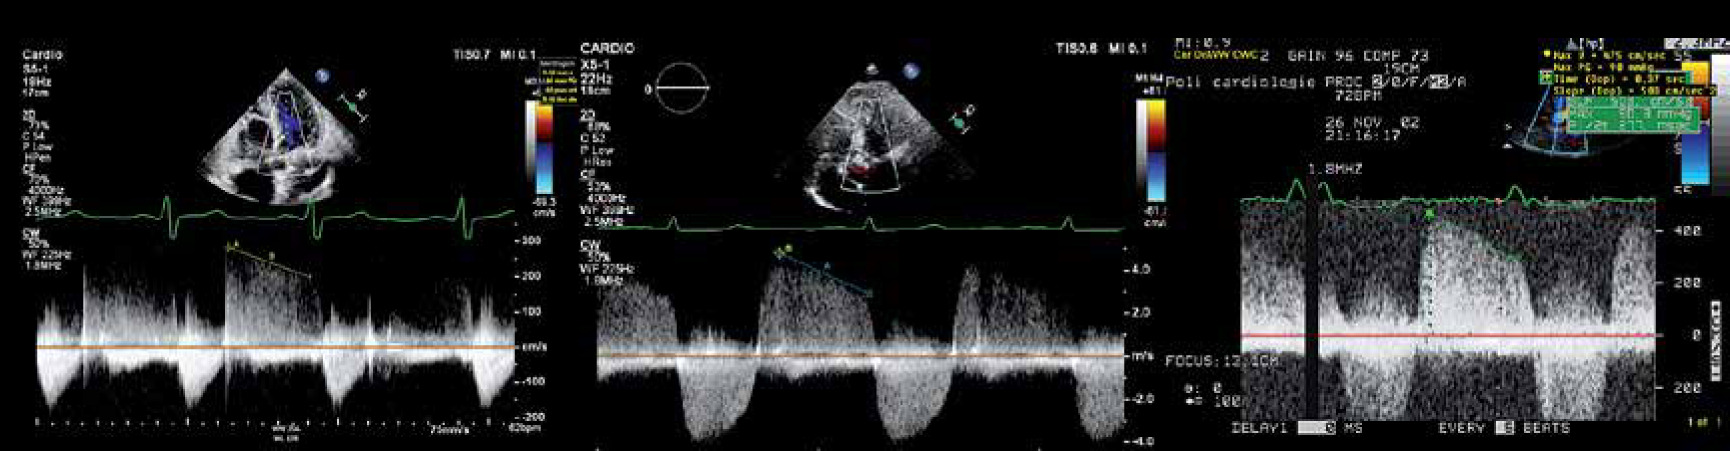
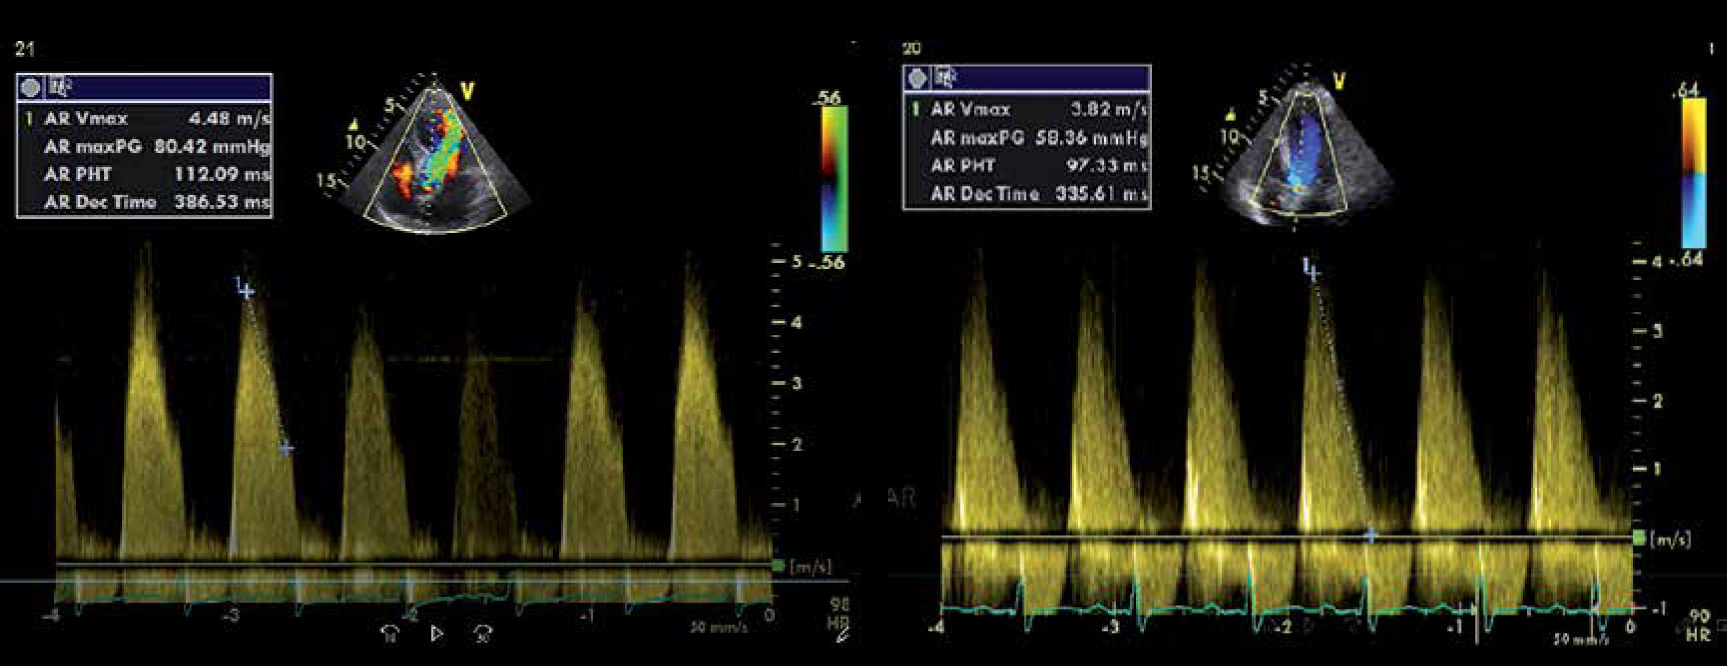
FIGURE 6
Continuous wave (CW) signal of the aortic regurgitation in patients with severe aortic regurgitation (AR). CW aortic regurgitant flow of a severe AR. a – Shows severe chronic AR. The pressure half time (PHT) is 112 ms. Panel B shows a typical example of an AR CW regurgitant signal of severe acute AR. PHT = 97 ms. Note that the slope drops to 0 m/s. This means that the left ventricular diastolic blood pressure equals the aortic diastolic blood pressure
Pressure half time
Measurement of pressure half time (PHT) is a semiquantitative method to assess AR severity (Figure 6). Essentially, this method is a quantification of the shape of the AR regurgitant shape (see above: Shape of the CW regurgitant signal). By definition, PHT is the time for the peak pressure to drop to half its value. It is also the time interval for the peak velocity to reach the velocity that equals the peak velocity divided by (= 1.4) [11, 12].
The PHT is always proportional to the deceleration time (DT) [13]:
PHT = 0.29 × DT
In patients with severe AR, the PHT becomes significantly shorter (PHT < 200 ms) [13].
VOLUMETRIC ASSESSMENT OF AORTIC REGURGITATION
Volumetric assessment of AR is based on the principle of preservation of flow. Preservation of flow, expressed in the continuity equation, requires that the blood volume that enters the LV equals the blood volume that leaves the LV, in the assumption that there is no mitral regurgitation (Figure 7).
FIGURE 7
The principle of preservation of flow in the setting of aortic regurgitation. The principle of preservation of flow says that all blood that enters the left ventricle (LV) at diastole, must leave the LV at systole. Green = left ventricular outflow tract (LVOT) flow. Thus, Aortic Reg V = LVOT flow – MV flow
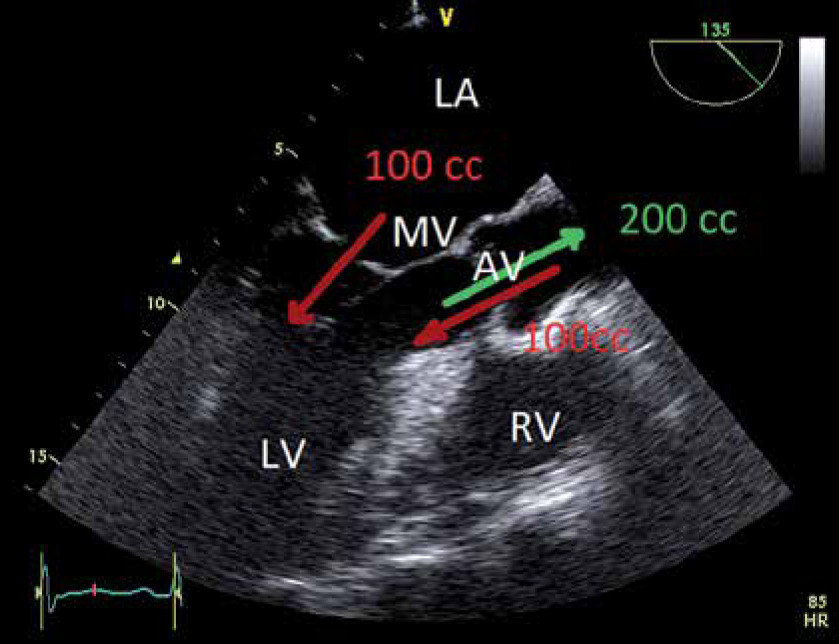
In the case of AR, this implies that the left ventricular outflow tract flow equals the sum aortic regurgitant flow (aortic reg. flow) and mitral valve flow (MV flow), during diastole. Thus:
Aortic Reg V = LVOT flow – MV flow
In part I, the calculation of the LVOT stroke volume was explained:
LVOT flow = (DLVOT/2)2 × π × VTILVOT
Similarly, the MV flow can be calculated using VTIMV and MV annulus diameter (DMV annulus):
MV flow = (DMV annulus/2)2 × π × VTIMV
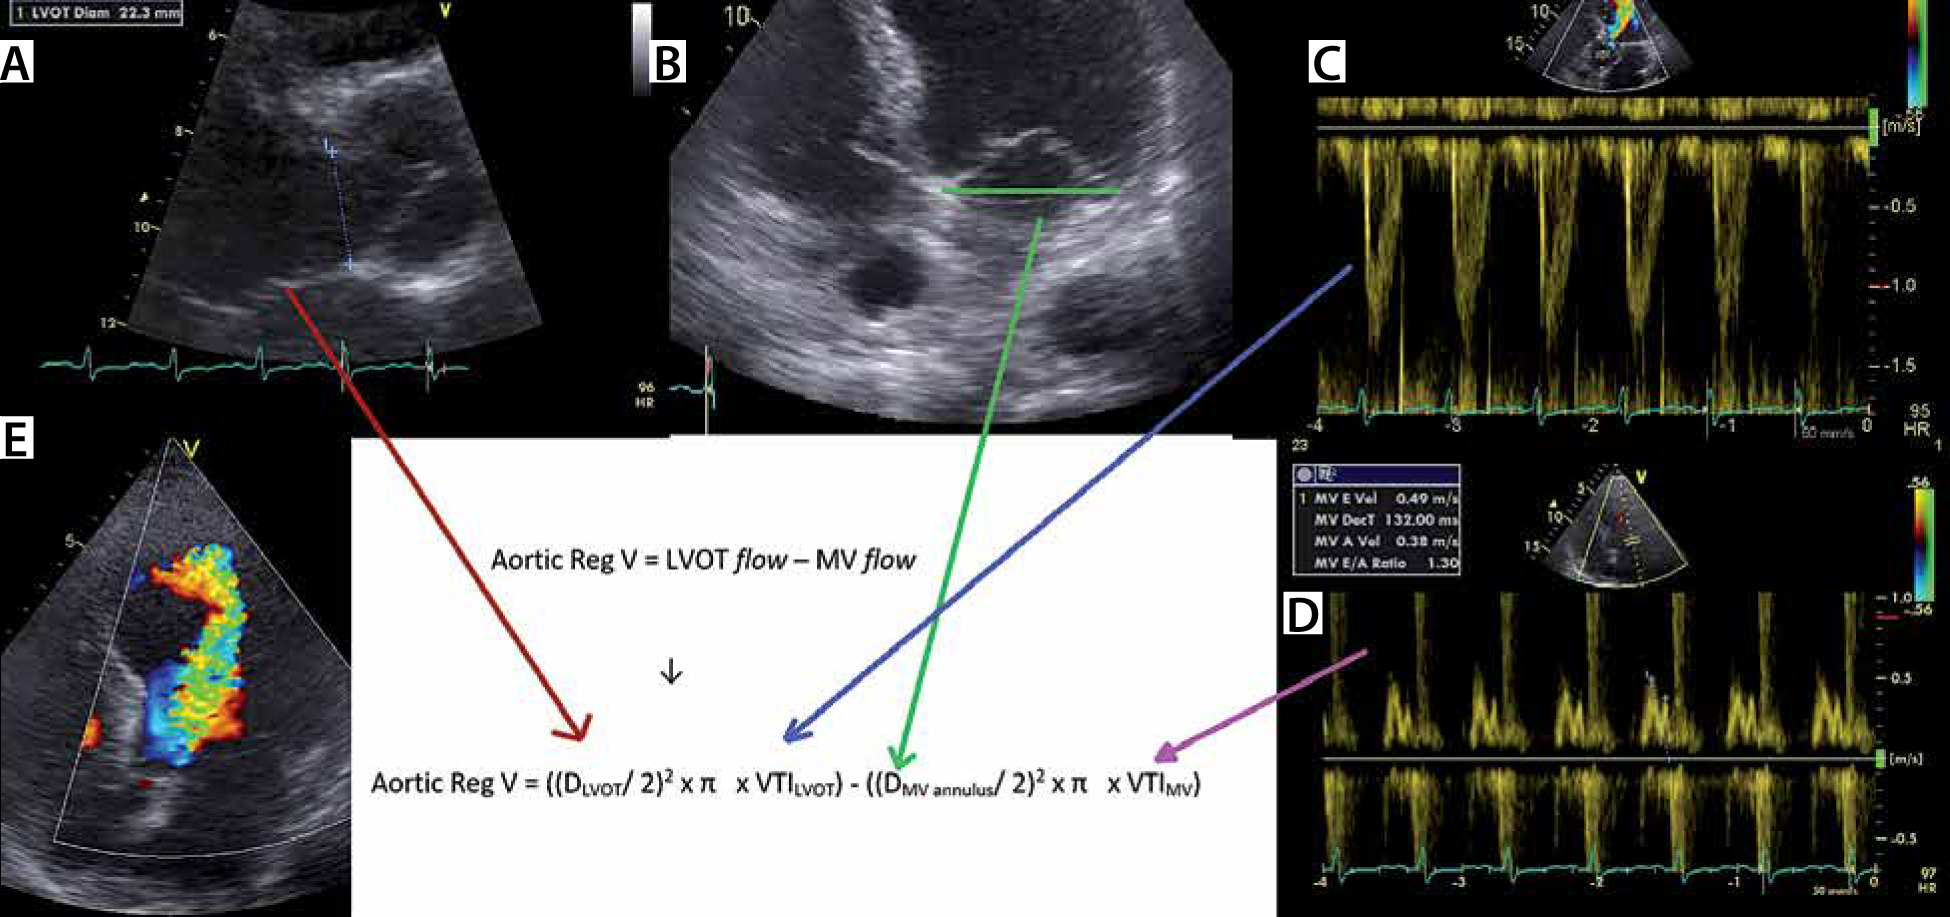
The continuity equation for AR can be rewritten as follows (Figure 8):
Aortic Reg V = LVOT flow – MV flow
or
Aortic Reg V = ((DLVOT/2)2 × π × VTILVOT) – ((DMV annulus/2)2 × π × VTIMV)
Finally, the RF can be calculated:
RF = (Aortic Reg V/LVOT stroke volume) × 100%
or
RF = (Aortic Reg V/(DLVOT/2)2 × π × VTILVOT)) × 100%
FIGURE 8
Volumetric assessment of aortic regurgitation (AR) by pulsed wave (PW) echo Doppler. Example of volumetric AR quantification. a – Shows measurement of the left ventricular outflow tract (LVOT) diameter. B – Measurement of mitral valve annular diameter. C – By contouring the LVOT PW signal (PW: pulsed wave echo Doppler), the LVOT velocity time integral (VTI) can be measured. d – By contouring the transmitral PW signal, the transmitral (MV) VTI can be measured. e – The massive AR jet on colour Doppler echo
Flow volume is the product of area and VTI. Thus, the EROA is calculated by dividing regurgitant volume by VTIAR
Proximal isovelocity surface area
Proximal isovelocity surface area (PISA) is another method that can be used to calculate the EROA [14, 15]. Especially in mitral regurgitation, this method is used in daily clinical practice in the echo laboratory. However, this principle can be used to assess the EROA in AR but is rarely used in the emergency and ICU settings.
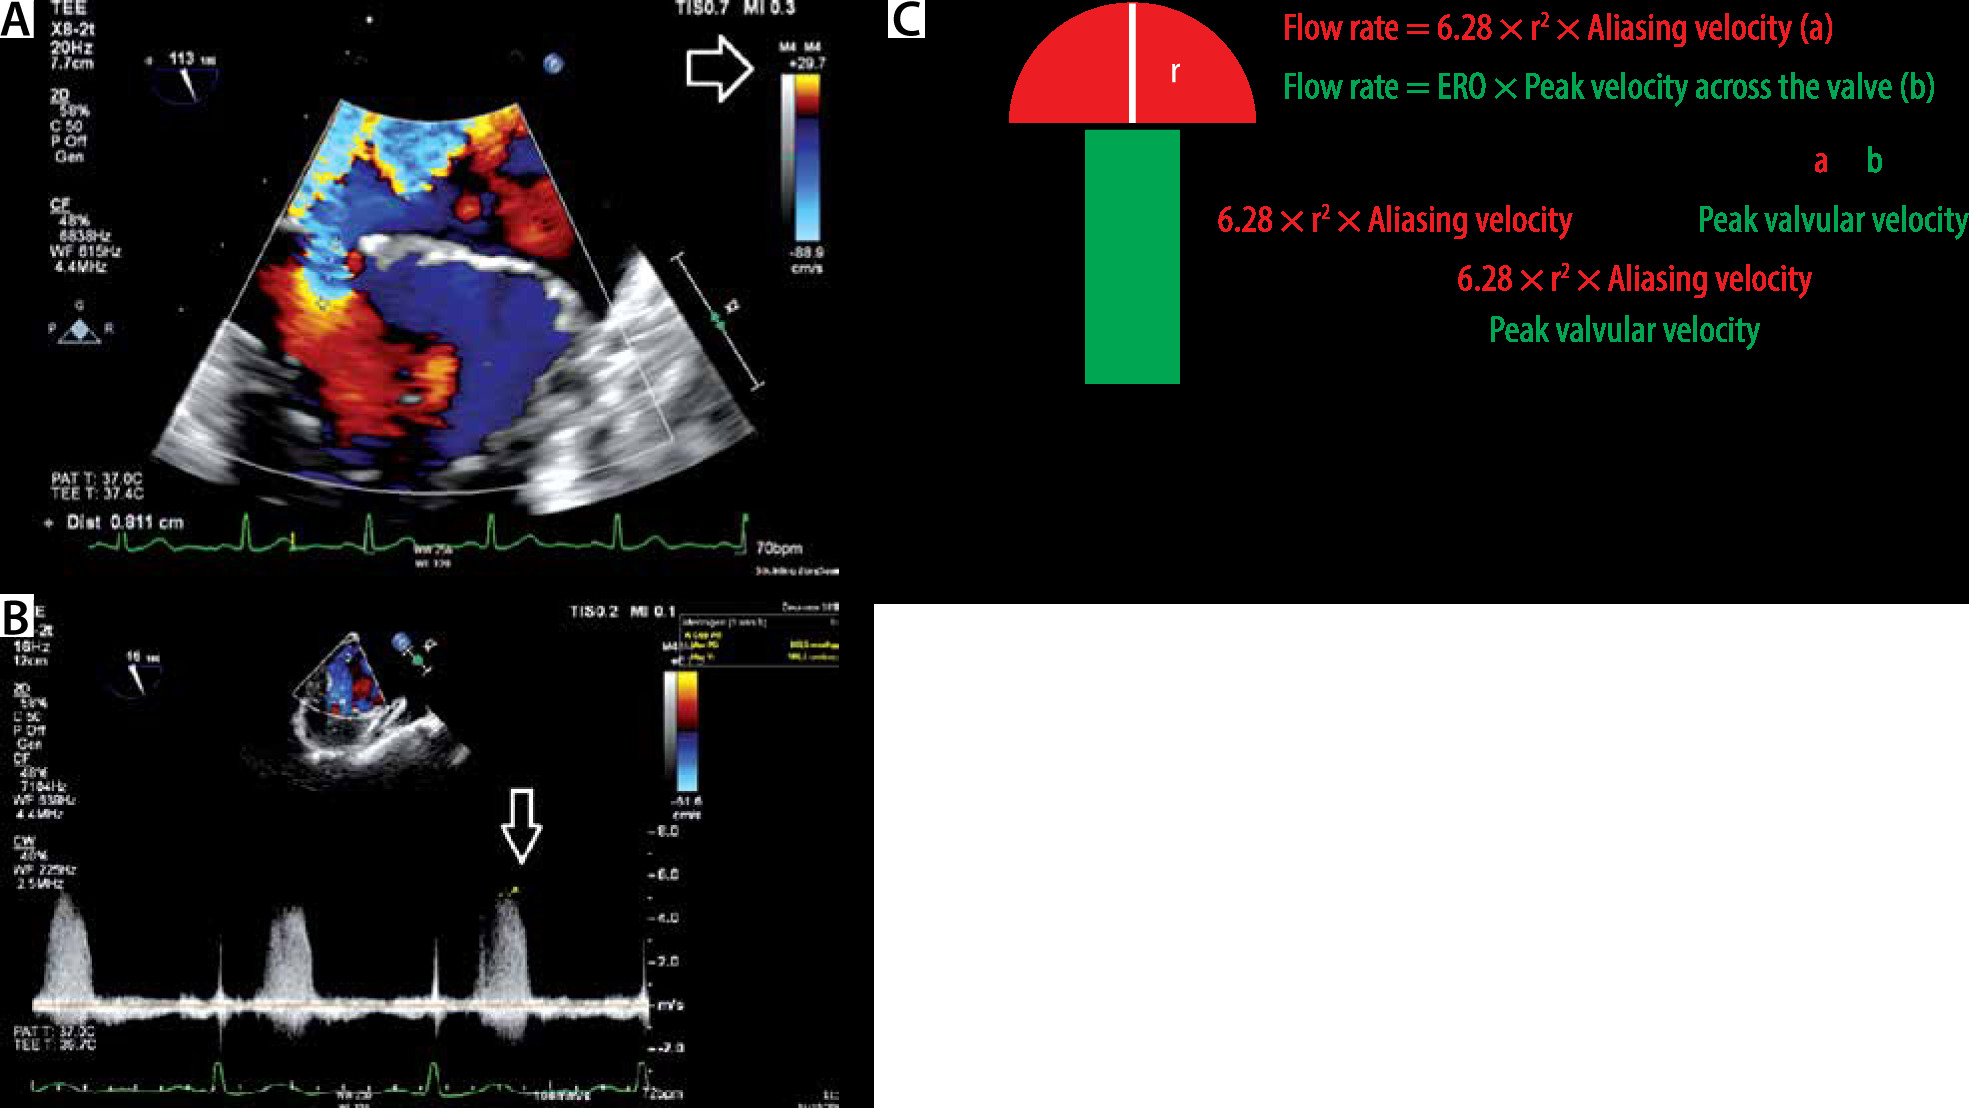
As the blood flow nears the regurgitant orifice, flow converges towards the EROA, with formation of multiple hemispheric shells of the same velocity (isovelocity). The flow rate at the surface of such a hemispheric shell is the same as the flow through the EROA, due to the principle of preservation of flow. By adjusting the Nyquist limit of the colour flow map (CFM), the velocity at the surface can be determined [13]. The radius (r) of the PISA can be measured (Figure 9). The area of the hemisphere is calculated as 2π(r)2. Thus, flow rate at the hemisphere can be expressed as follows:
Flow rate = 6.28 × r2 × Aliasing velocity (a)
FIGURE 9
Principle of proximal isovelocity surface area (PISA) to calculate effective regurgitant volume (ERO). a – Typical example of PISA measurement in mitral regurgitation. The white arrow shows that the Nyquist limit was decreased to 30 cm s-1. At a velocity of 30 cm s-1, the colour coding changes from blue to yellow. The PISA has a surface velocity of 30 cm s-1. The radius (r) was measured (0.8 cm). B – Measurement of the peak mitral regurgitation velocity. C – The principle of the measurement. The flow proximal to the ERO (red) equals the flow after the ERO (green). If the PISA radius, the Nyquist velocity and the peak regurgitant velocity are measured, the ERO can be calculated. The same principle can be applied on aortic regurgitation. In this case, PISA radius = 0.81 cm, alias velocity (Nyquist) = 29.7 cm s-1 and the mitral peak velocity (CW) = 509 cm s-1. ERO = (6.28 × 0.812 × 29.7)/509 = 0.24 cm2
The flow through the EROA a valve can be determined by multiplying EROA with the peak velocity through the EROA.
Flow rate = EROA × Peak velocity across the valve (b)
Due to preservation of flow (a) equals (b). In the case of AR, this equation can be expressed:
6.28 × r2 × Aliasing velocity = EROA × Peak AR velocity
EROA = (6.28 × r2 × Aliasing velocity)/Peak AR velocity
Colour flow imaging of the aortic regurgitation jet width
Colour flow imaging of AR is best performed in the parasternal long-axis and short-axis views (by TTE windows) or the LVOT view (by the trans-oesophageal echocardiography [TEE] window at 135 degrees) [13]. Basically, colour flow imaging is pulsed Doppler ultrasound with different signal processing and display [3].
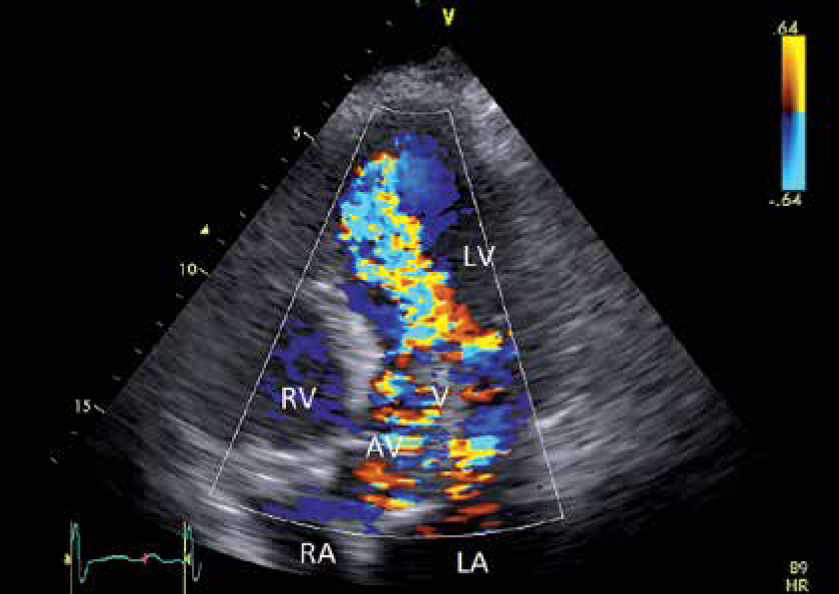
This semiquantitative method has been proven to be extremely useful in severity assessment. By integrating the data from different tomographic planes, the three-dimensional shape of the regurgitant jet can be estimated. A scale from 0 to 4+ describes the AR severity, with 0 being no regurgitation, 1+ mild regurgitation, 2+ and 3+ being moderate AR and 4+ being severe AR (the regurgitant jet reaches the apex and nearly fills the LV) [3] (Figure 10).
FIGURE 10
Colour flow mapping in aortic regurgitation (AR). Example of diastolic colour flow mapping in a patient with severe AR. Remark the regurgitation jet reaching the apex. LV – left ventricle, RV – right ventricle, LA – left atrium, RA – right atrium, MV – mitral valve, AV – aortic valve, AV – aortic valve, V – vegetation
Vena contracta
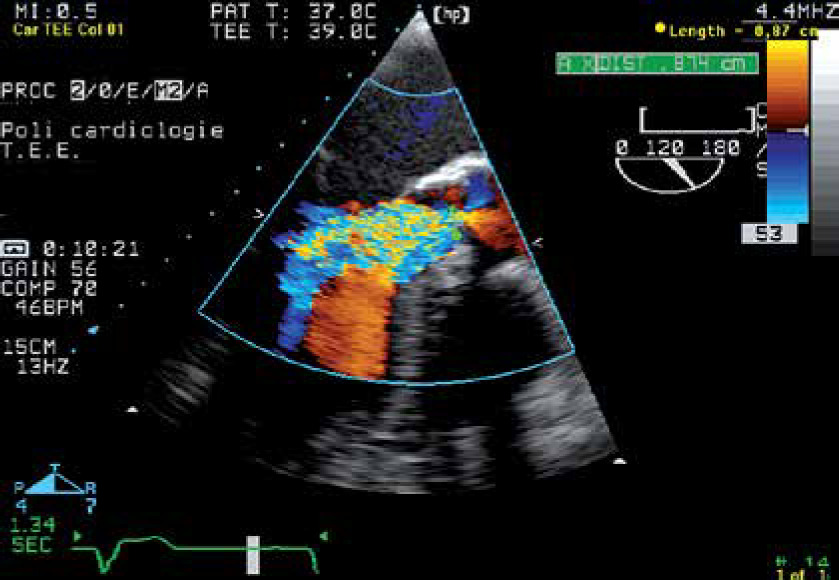
The width of the vena contracta (VC-W) is the smallest area in the regurgitant flow, between the proximal laminar flow acceleration zone and the distal turbulent regurgitant jet spray (Figure 11). The EACVI (European Association of Cardiovascular Imaging) Echo Handbook defines a VC-W > 6 mm as a criterion for severe AR [16]. Studies have demonstrated that the measurement of the VC-W is simple and reproducible [17–19]. It has been stated that this method is less dependent on loading conditions in assessing AR severity.
FIGURE 11
Vena contracta width (VC-W) transoesophageal echocardiography image. The width of the vena contracta (VC-W) is the smallest area in the regurgitant flow, between the proximal laminar flow acceleration zone and the distal turbulent regurgitant jet spray
The vena contracta jet shape is not always circular. Therefore, the VCW measurement may over- or underestimate AR severity. Three-dimensional (3D) echocardiography can directly measure the vena contracta area (VCA). Not surprisingly, studies have shown that 3D VCA measurement is superior to VC-W measurement for AR quantitation [20–24].
Diastolic flow reversal in the descending aorta
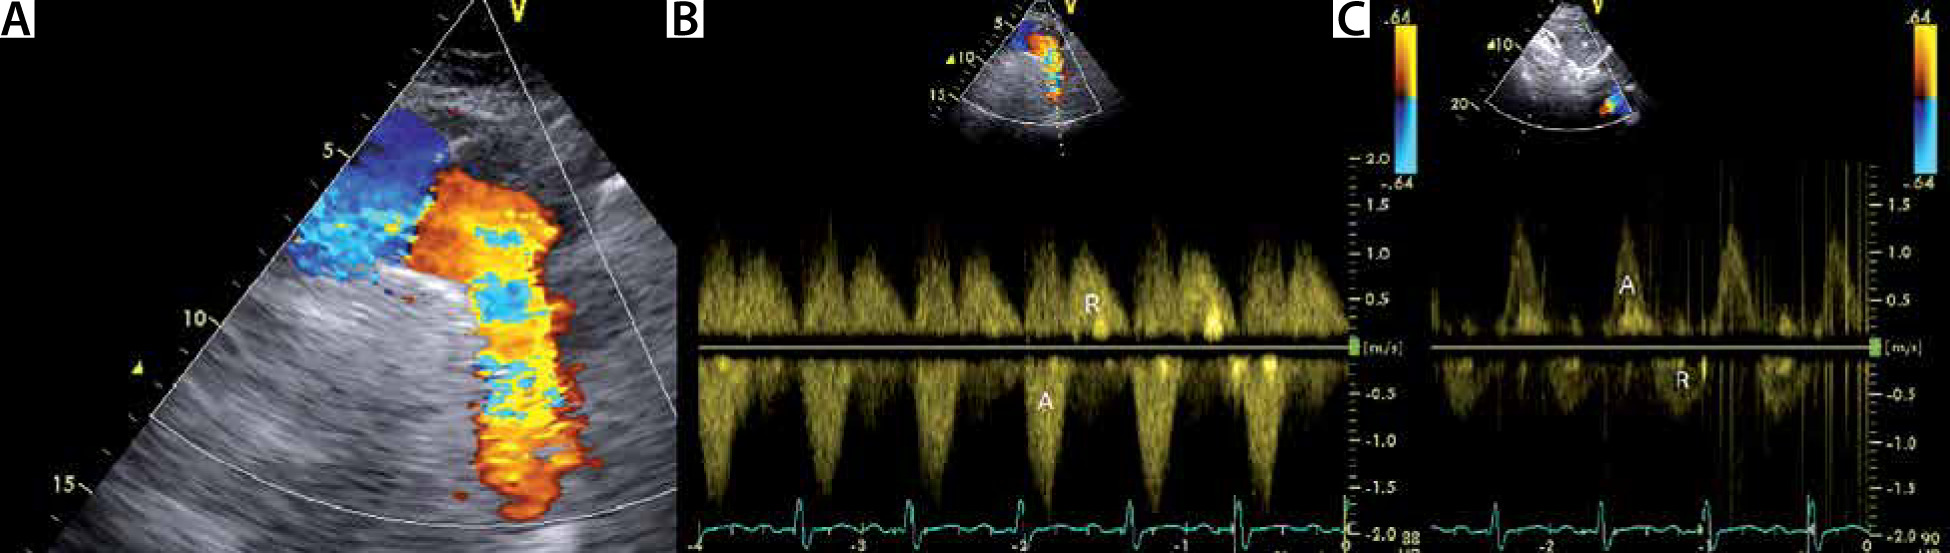
Holodiastolic flow reversal in the descending thoracic aorta (see Figure 12A and B) and in the abdominal aorta (see Figure 12C) are associated with AR severity. Holodiastolic flow reversal in the abdominal aorta, measured from a subcostal window, is sensitive (100%) and specific (97%) for severe AR [3]. Holodiastolic flow reversal in the descending thoracic aorta is also very sensitive, but less specific, and may be seen in some patients with moderate AR [3].
FIGURE 12
Holodiastolic flow reversal in the descending thoracic aorta and abdominal aorta. a – Suprasternal view of the aortic arch. Note the regurgitant flow in the descending aorta (right side of the image). By echo Doppler convention, colour flow mapping (CFM) codes blood travelling towards the echo probe in red colour. B – Holodiastolic flow reversal (R) in the descending aorta is a sign of severe aortic regurgitation. C – Holodiastolic flow reversal in the abdominal aorta. This is an even stronger sign of severe aortic regurgitation than holodiastolic flow reversal (R) in the descending aorta. A – antegrade flow
Take home message on holodiastolic flow reversal in the descending thoracic aorta
Holodiastolic flow reversal in the descending thoracic aorta and in the abdominal aorta are sensitive markers detecting severe AR.
Compared to holodiastolic flow reversal in the abdominal aorta, holodiastolic flow reversal in the descending aorta has a higher sensitivity but a lower specificity to detect severe AR.
Diastolic filling pattern
The basics of echo Doppler assessment of diastolic function and LV loading were discussed in a previous paper [25]. Part I recaps the most relevant filling patterns [4]. A restrictive mitral flow pattern is present in acute severe AR.
Integration of all transthoracic echocardiography measurements
The severity of AR is determined by integrating of all pieces of information obtained from the TTE. The assessment of severity of AR includes not only qualitative and quantitative grading of the AR, but also presence of eccentric remodelling and the diastolic filling pattern. The famous echocardiography textbook of Oh et al. lists the criteria for severe AR as follows [13]:
regurgitant jet width/LVOT diameter ratio ≥ 60%,
regurgitant jet area/LVOT area ratio ≥ 60%,
AR PHT ≤ 250 ms (PHT < 200 ms according to the most recent guidelines),
restrictive transmitral diastolic filling pattern (usually in the acute setting),
holodiastolic flow reversal in the descending aorta,
dense CW doppler AR signal,
RF ≥ 50%,
regurgitant volume ≥ 60%,
effective regurgitant orifice (ERO) ≥ 0.3 mL,
in chronic AR: LV end-diastolic diameter ≥ 7.5 cm,
mild AR is defined as regurgitant jet width/LVOT diameter ratio ≤ 30%, regurgitant jet area/LVOT area ratio ≤ 30%, AR PHT ≤ 250 ms, mild early flow reversal in the descending aorta, faint CW doppler AR signal, RF ≤ 30%, ERO ≤ 0.1 cm2, and LV end-diastolic diameter ≤ 6.0 cm.
Table 1 lists the criteria for severe AR from the ESC guidelines of valvular heart disease (2017) and/or The EACVI Echo Handbook [10, 16].
Role of transoesophageal echocardiography
TEE is clinically useful in the assessment of AR in many ways. TEE is helpful in determining the aetiology of AR.
In patients with AR, leaflet abnormalities should be differentiated from AR secondary to aortic root abnormalities. The AV, the aortic root and the first part of the ascending aorta can be well visualized by TEE.
Infective endocarditis is a cause of severe AR. TEE is superior to TTE in depicting complications of infective endocarditis that require (semi)-urgent surgical intervention.
The size of the vegetation: patients with vegetations > 1 cm are at higher risk of embolic complications [26–29].
Perivalvular abscesses (Figures 13 and 14) and phlegmons can be better evaluated on TEE. These findings are alarm signs, with high mortality if not promptly treated.
Paravalvular fistula and leaflet perforation can be better detected by TEE (Figures 13 and 14).
In infective endocarditis of the AV, the adjacent mitral valve (MV) may be involved. Rigorous inspection of the MV is required (Figure 15).
A bicuspid AV should be differentiated from a tricuspid AV. Inspection of the AV by TEE usually allows differentiation between bicuspid and tricuspid AV. However, in the case of severe calcification the differentiation may be challenging.
FIGURE 13
A – Transoesophageal echocardiography (TEE) 135° view demonstrating aortic regurgitation due infective endocarditis. TEE 135° view. Note the 2 vegetations. One vegetation is oscillating in the LVOT (dark V) and the other vegetation (white V) is attached to the wall that is shared by the aortic valve (AV) and mitral valve (MV). There is paravalvular thickening around the AV (phlegmon) (#) with an abscess in the centre (white arrow). B – Colour imaging with aortic regurgitation. Note the small paravalvular flow (black arrow) from the abscess to the left ventricle, which implies the formation of a fistula. LV – left ventricle, RV – right ventricle, LA – left atrium, MV – mitral valve, AV – aortic valve, MV – mitral valve, V – vegetation
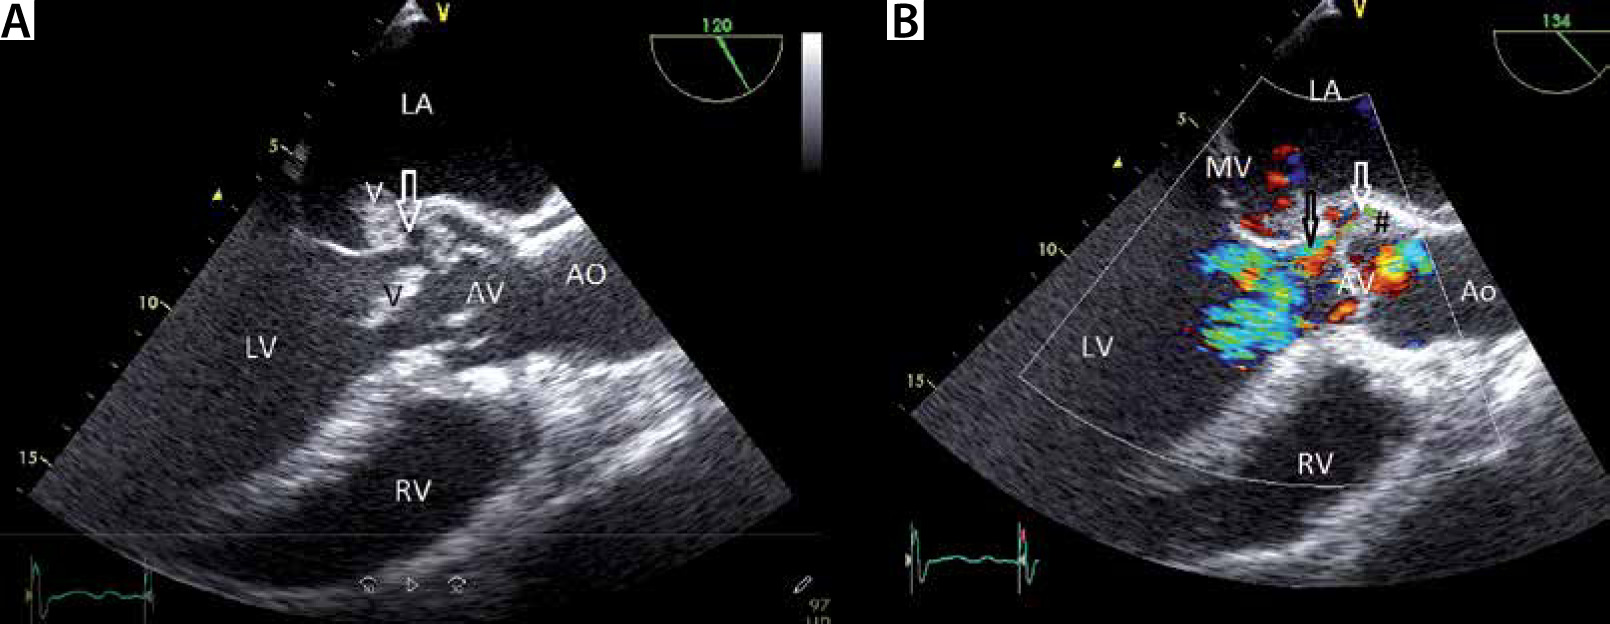
FIGURE 14
A – Transoesophageal echocardiography (TEE) 38° view (short axis view), demonstrating severe aortic regurgitation due to infective endocarditis. TEE 38° view (short axis view). Note the vegetation (V) and paravalvular thickening around the AV (phlegmon) with an abscess in the centre (arrow). B – Colour imaging with aortic regurgitation. LV – left ventricle, RV – right ventricle, LA – left atrium, AV – aortic valve, RA – right atrium, V – vegetation, TV – tricuspid valve
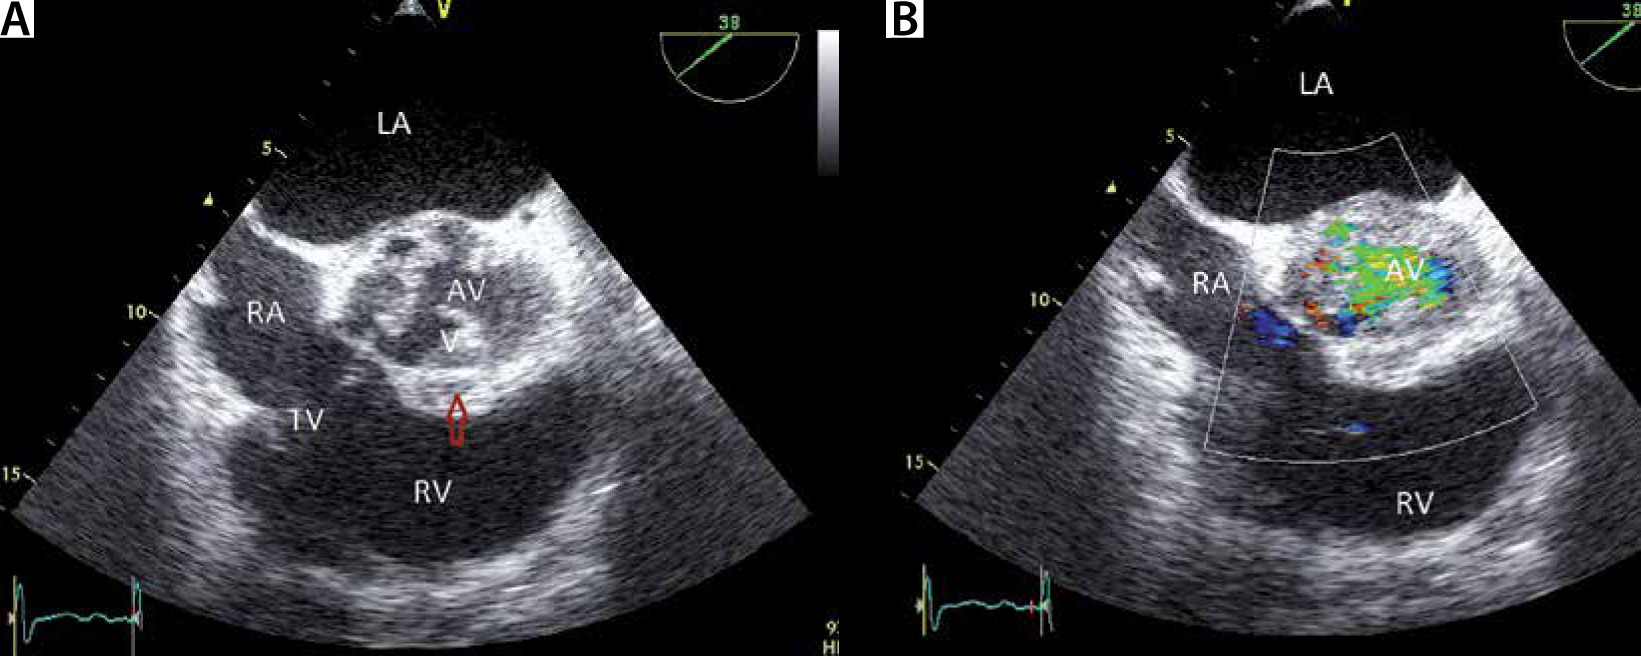
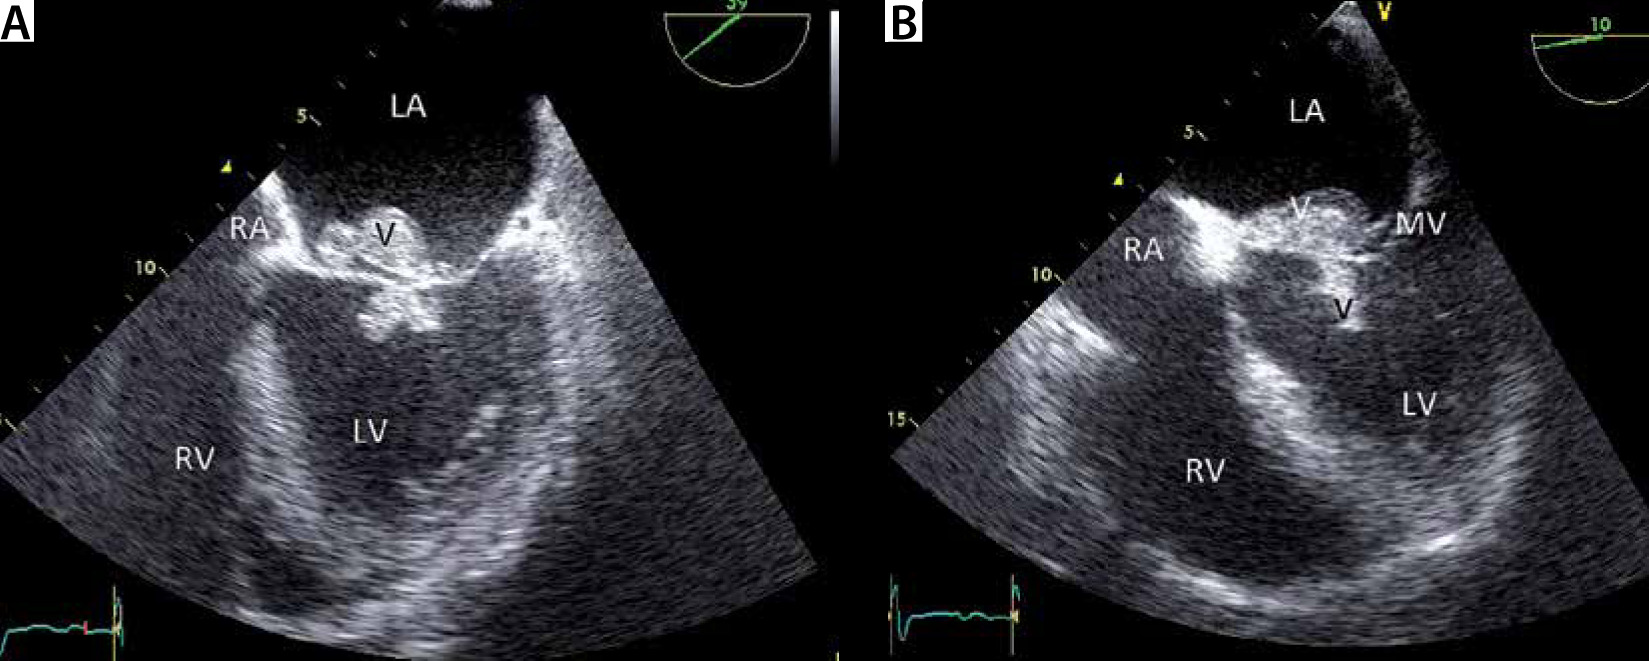
FIGURE 15
Transoesophageal echocardiography (TEE) image showing involvement of mitral valve (MV) in the infective endocarditis process of a patient with severe aortic regurgitation due to infective endocarditis. a and B – Same patient as in Figures 13 and 14. The mitral valve is also involved in the infective endocarditis process. Note the large vegetations (V). This image illustrates the relevance of completeness of TEE examination. LV – left ventricle, RV – right ventricle, LA – left atrium, RA – right atrium, V – vegetation, MV – mitral valve
Finally, it should be emphasized that echo Doppler TEE cannot quantify the AR severity by the continuity equation, because the ultrasound beam cannot be aligned parallel to flow across the AV.
Echocardiography acquired strain imaging
While several studies have demonstrated that reduced LV global longitudinal strain (LV-GLS) is associated with reduced outcome after AVR in patients suffering from severe AS, this correlation is less well investigated in patients with AR.
A study including 115 patients with AR and 55 control individuals demonstrated that lower resting values of LV-GLS in severe AR asymptomatic patients suggest early subclinical myocardial damage that seems to be closely associated with lower exercise capacity, greater pulmonary congestion, and blunted LV contractile reserve during stress [30].
Another series, examining patients undergoing AVR due to AR, sought a correlation between LV-GLS and outcome. In patients with ≥ 3+ chronic AR and preserved LVEF undergoing AVR, a baseline LV-GLS value worse than –19% was associated with reduced survival. Further, persistently impaired LV-GLS after AVR was associated with increased mortality [31].
NEW IMAGING MODALITIES TO ASSESS AORTIC REGURGITATION
In part I, the advantages and pitfalls of CMR to AV lesions were discussed [4]. In the setting of ICU medicine, the beside approach of echocardiography is a major advantage [32–34] compared to CMR.
Due to the limitations of the echocardiographic qualitative, semi-quantitative, and quantitative methods for the assessment of AR, current echocardiographic guidelines strongly recommend an integrative approach using multiple qualitative and quantitative methods to assess the AR severity grade. Not surprisingly, CMR acquired AR grading has gained interest in the medical community.
Phase-contrast velocity mapping is used to determine the forward and reverse flow per cardiac cycle directly. Regurgitant volume is the difference between LV stroke volume from the LV measurements and forward aortic volume. From these the RF is calculated (regurgitant volume/forward volume × 100) [35].
Alternatively, the regurgitant volume can be calculated by cine assessment and comparison of LV and right ventricle (RV) stroke volumes, assuming there is no other valve disease [35, 36].
There is a moderate correlation between regurgitant volumes measured by echocardiography and CMR, but the observer variability is significantly lower with CMR [37].
The ESC guidelines recommend volumetric quantification of AR by CMR when the cardiac ultra-sound findings are equivocal regarding AR severity [10].
The role of cardiac CT in the assessment of native AR severity per se is limited. However, AR commonly co-exists with aortic dilatation, necessitating evaluation of the thoracic aorta by thoracic CT. Most recent cardiac CT research in the field of AV disease focusses on the question whether specific anatomical features, such as bicuspid AV and calcification severity, predict outcome (mortality, iatrogenic AR, …) after TAVR [38–41].
INVASIVE ASSESSMENT OF AORTIC REGURGITATION
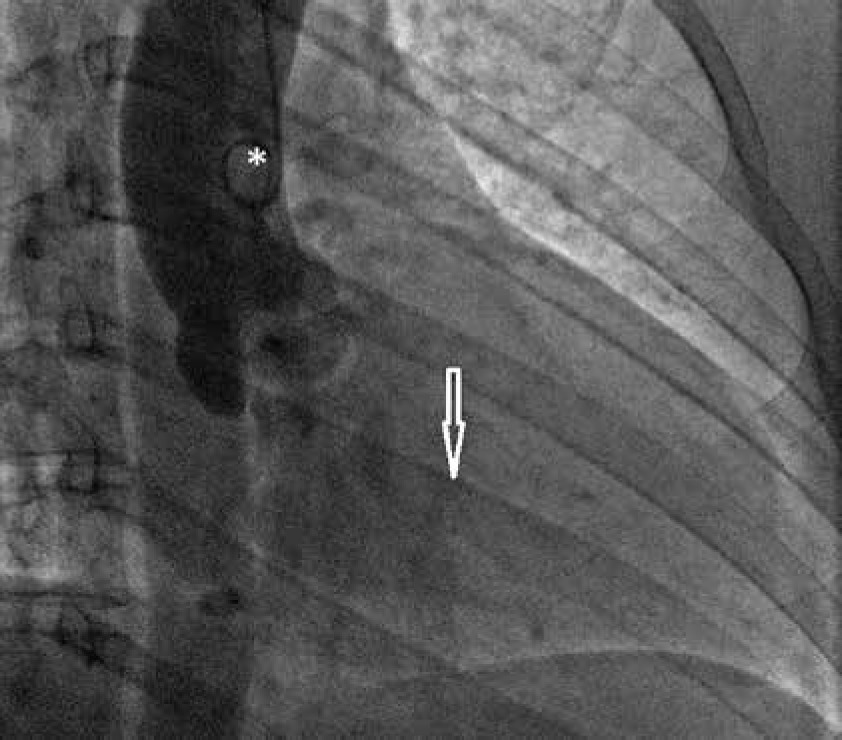
Invasive evaluation of AR does not provide true quantitation of the AR, because it relies on aortic root angiography, which is a semiquantitative grading system, describing the degree of opacification of the LV by the regurgitant jet (Figure 16). By convention, the AR severity grading is defined as follows:
grade 1: brief and incomplete ventricular opacification; clears rapidly;
grade 2: moderate opacification of the ventricle that clears in less than 2 cycles; never greater than aortic root opacification;
grade 3: opacification of the ventricle equal to aortic root opacification within 2 cycles; delayed clearing of ventricle over several cycles;
grade 4: opacification of the ventricle almost immediately that is greater than that of the aortic root with delayed clearing of the ventricle.
FIGURE 16
Assessment of aortic regurgitation by invasive aortography. After dye injection via the pigtail catheter (*), positioned in the ascending aorta, the aorta root and ascending aorta opacify. Dye in the left ventricular cavity (arrow) confirms the presence of aortic regurgitation (see text for explanation)
Catheterization allows assessment of the aortic root size and the LVEF. Haemodynamic measurements indirectly assess the severity AR, by assessing the left ventricular (LVEDP) and cardiac output.
TREATMENT OF AORTIC REGURGITATION
Indications for aortic valve surgery
The ESC guidelines of valvular heart disease (2017) divide the indications for AV surgery into two main categories: severe AR and aortic root disease (irrespective of the severity of AR) [10]. In patients with severe AR, the presence of symptoms, reduced LV EF, and LV size are the key elements in clinical decision making.
According to these ESC guidelines, AVR/repair is indicated in severe AR, if [10]:
surgery is indicated in symptomatic patients (Class I B),
surgery is indicated in asymptomatic patients with resting LVEF ≤ 50% (Class I B),
surgery is indicated in patients undergoing CABG or surgery of the ascending aorta or of another valve (Class I C),
Heart Team discussion is recommended in selected patients in whom AV repair may be a feasible alternative to valve replacement (Class I C),
surgery should be considered in asymptomatic patients with resting ejection fraction > 50% with severe LV dilatation: LVEDD > 70 mm or LVESD > 50 mm (or LVESD > 25 mm m-2 BSA in patients with small body size) (Class IIa B).
The ESC guidelines recommend surgery for aortic root disease (irrespective of the severity of AR) as follows [10]:
AV repair, using the reimplantation or remodelling with aortic annuloplasty technique, is recommended in young patients with aortic root dilation and tricuspid aortic valves, when performed by experienced surgeons (Class I C);
surgery is indicated in patients with Marfan syndrome who have aortic root disease with a maximal ascending aortic diameter ≥ 50 mm (Class I C);
surgery should be considered in patients who have aortic root disease with maximal ascending aortic diameter:
when surgery is primarily indicated for the AV, replacement of the aortic root or tubular ascending aorta should be considered when ≥ 45 mm, particularly in the presence of a bicuspid valve (Class IIa B).
Medical therapy
AR causes a volume and pressure overload state of the left ventricle as the increased stroke volume is ejected into the high resistance aorta [9]. From a physiological point of view, afterload reduction makes sense as it reduces the AR volume, and thus prevents further LV dilation.
A study comparing nifedipine and digoxin in patients with severe AR and left ventricular dilation demonstrated that treatment with nifedipine was associated with a 6-year event-free survival rate of 85% compared to 65% in those in the digoxin group [42].
Small studies have shown that angiotensin converting enzyme (ACE) inhibitors slow the progression of LV dilation [43–47].
However, it has been advocated that vasodilator therapy may have deleterious effects as it may result in only a ‘cosmetic’ effect, masking the onset of significant symptoms or LV dysfunction [48].
The ESC guidelines [10] state that: ‘Medical therapy can provide symptomatic improvement in individuals with chronic severe AR in whom surgery is not feasible. In patients who undergo surgery but continue to suffer from heart failure or hypertension, angiotensin-converting enzyme (ACE) inhibitors, angiotensin receptor blockers (ARBs) and beta-blockers are useful’ [49, 50]. Apart from AR due to infective endocarditis, the treatment of AR in the ICU will focus on treatment of congestive heart failure (reducing volume overload) and afterload reduction.
Take home messages on treatment of AR
Presence of symptoms, reduced LV EF and LV dilation are the key elements in the decision making/timing of aortic valve replacement/repair in patients with severe AR.
In patients with aortic root disease (irrespective of the severity of AR), surgery is indicated if the ascending aorta diameter ≥ 50 mm in patients with a bicuspid AV and ≥ 55 mm in other cases.
Medical therapy (ACE inhibitors, angiotensin receptor blockers (ARBs) and beta-blockers) can provide symptomatic improvement in individuals with chronic severe aortic regurgitation in whom surgery is not feasible.
CONCLUSIONS
Inadequate diastolic closure of the AV causes AR. Diastolic regurgitation towards the LV causes LV volume overload, resulting in eccentric LV remodelling. Symptoms occur when the adaptation mechanisms can no longer handle the LV volume overload.
TTE is the first line examination in the work-up of AR. A state-of-the-art overview of echocardiographic AR severity grading by 2D, M-mode, CFM, pulsed wave (PV) and continuous wave (CW) echo Doppler is provided. We summarize the key elements in the interpretation of echocardiographic AR severity grading in the form of take home messages (Tables 2 and 3).
TABLE 2
Assessment of aortic regurgitation (AR): take home messages
TABLE 3
Haemodynamic parameters that can be derived from TTE/TEE in the work-up of AR
[i] PLAX – parasternal long axis view, PSAX – parasternal short axis view, 5CH – apical 5-chamber view, 4CH – apical 4-chamber view, D – LVOTd, LVEDV(D) – left ventricular end-diastolic volume (diameter), LVESV(D) – left ventricular end-systolic volume (diameter), LVEDA – LV end-diastolic area, LVESA – LV end-systolic area, DT – deceleration time, LAP – left atrial pressure, PEP – pre-ejection period, AcT – acceleration time, ET – ejection time, DT* – deceleration time of the AR regurgitation (CW)
We emphasize that assessment of AR severity never relies on one single echocardiographic measurement, but requires integration of all pieces of information, obtained from all these echocardiographic modalities.
Finally, we overview the criteria for valve surgery in AR. Besides severe AR, presence of symptoms, LVEF, LV dimensions, and aortic root/ascending aorta diameter are the key elements in timing surgical treatment. The role of vasodilator therapy in the treatment of AR is briefly discussed.